Chart: Chartsheet
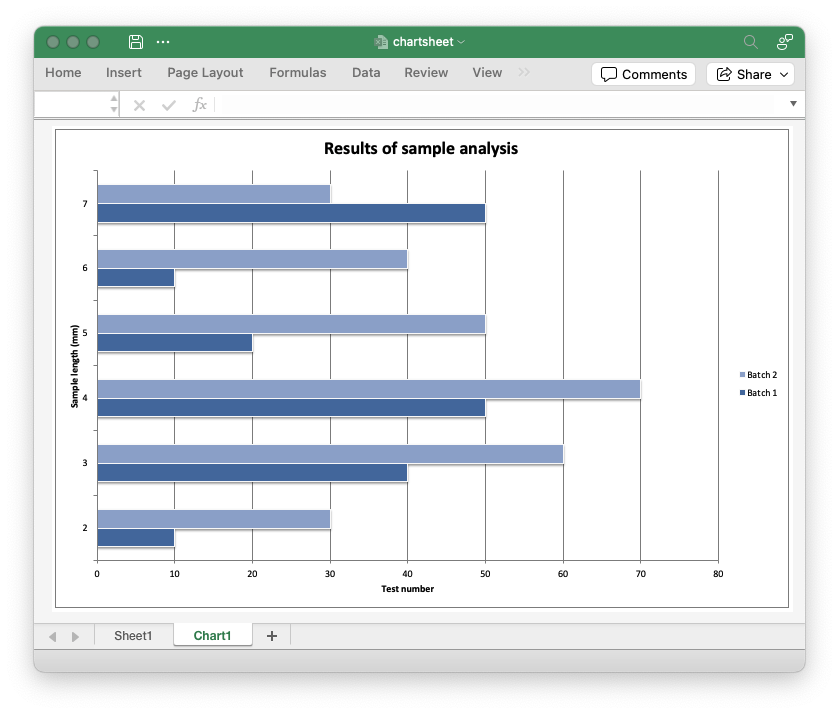
In Excel a chartsheet is a type of worksheet that it used primarily to display one chart. It also supports some other worksheet display options such as headers and footers, margins, tab selection and print properties
Image of the output file:
Code to generate the output file:
// SPDX-License-Identifier: MIT OR Apache-2.0
//
// Copyright 2022-2026, John McNamara, jmcnamara@cpan.org

//! An example of creating a chartsheet style chart using the `rust_xlsxwriter` library.

use rust_xlsxwriter::{Chart, ChartType, Format, Workbook, XlsxError};

fn main() -> Result<(), XlsxError> {
    let mut workbook = Workbook::new();
    let worksheet = workbook.add_worksheet();
    let bold = Format::new().set_bold();

    // Add the worksheet data that the chart will refer to.
    worksheet.write_with_format(0, 0, "Number", &bold)?;
    worksheet.write_with_format(0, 1, "Batch 1", &bold)?;
    worksheet.write_with_format(0, 2, "Batch 2", &bold)?;

    let data = [
        [2, 3, 4, 5, 6, 7],
        [10, 40, 50, 20, 10, 50],
        [30, 60, 70, 50, 40, 30],
    ];
    for (col_num, col_data) in data.iter().enumerate() {
        for (row_num, row_data) in col_data.iter().enumerate() {
            worksheet.write(row_num as u32 + 1, col_num as u16, *row_data)?;
        }
    }

    // Create a new bar chart.
    let mut chart = Chart::new(ChartType::Bar);

    // Configure the data series for the chart.
    chart
        .add_series()
        .set_categories("Sheet1!$A$2:$A$7")
        .set_values("Sheet1!$B$2:$B$7")
        .set_name("Sheet1!$B$1");

    chart
        .add_series()
        .set_categories("Sheet1!$A$2:$A$7")
        .set_values("Sheet1!$C$2:$C$7")
        .set_name("Sheet1!$C$1");

    // Add a chart title and some axis labels.
    chart.title().set_name("Results of sample analysis");
    chart.x_axis().set_name("Test number");
    chart.y_axis().set_name("Sample length (mm)");

    // Set an Excel chart style.
    chart.set_style(11);

    // Create a chartsheet.
    let chartsheet = workbook.add_chartsheet();

    // Add the chart to the chartsheet. The row/col position is ignored.
    chartsheet.insert_chart(0, 0, &chart)?;

    // Make the chartsheet the first sheet visible in the workbook.
    chartsheet.set_active(true);

    workbook.save("chartsheet.xlsx")?;

    Ok(())
}