Sparklines: simple example
Example of adding sparklines to an Excel spreadsheet using the rust_xlsxwriter
library.
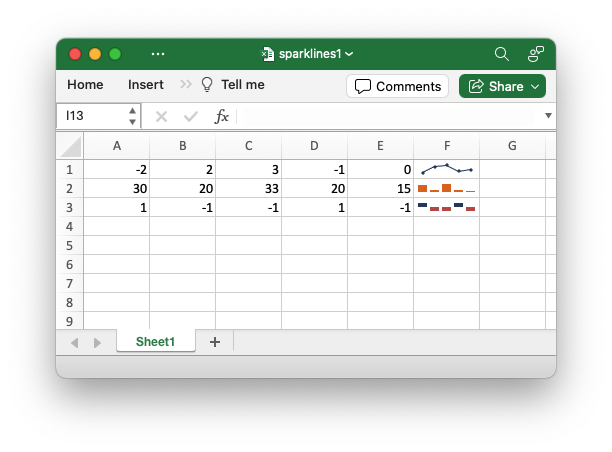
Sparklines are small charts that fit in a single cell and are used to show trends in data. This example shows the basic sparkline types.
Image of the output file:
Code to generate the output file:
// SPDX-License-Identifier: MIT OR Apache-2.0
//
// Copyright 2022-2026, John McNamara, jmcnamara@cpan.org

//! Example of adding sparklines to an Excel spreadsheet using the
//! `rust_xlsxwriter` library.
//!
//! Sparklines are small charts that fit in a single cell and are used to show
//! trends in data.

use rust_xlsxwriter::{Sparkline, SparklineType, Workbook, XlsxError};

fn main() -> Result<(), XlsxError> {
    // Create a new Excel file object.
    let mut workbook = Workbook::new();

    // Add a worksheet to the workbook.
    let worksheet = workbook.add_worksheet();

    // Some sample data to plot.
    let data = [[-2, 2, 3, -1, 0], [30, 20, 33, 20, 15], [1, -1, -1, 1, -1]];

    worksheet.write_row_matrix(0, 0, data)?;

    // Add a line sparkline (the default) with markers.
    let sparkline1 = Sparkline::new()
        .set_range(("Sheet1", 0, 0, 0, 4))
        .show_markers(true);

    worksheet.add_sparkline(0, 5, &sparkline1)?;

    // Add a column sparkline with a non-default style.
    let sparkline2 = Sparkline::new()
        .set_range(("Sheet1", 1, 0, 1, 4))
        .set_type(SparklineType::Column)
        .set_style(12);

    worksheet.add_sparkline(1, 5, &sparkline2)?;

    // Add a win/loss sparkline with negative values highlighted.
    let sparkline3 = Sparkline::new()
        .set_range(("Sheet1", 2, 0, 2, 4))
        .set_type(SparklineType::WinLose)
        .show_negative_points(true);

    worksheet.add_sparkline(2, 5, &sparkline3)?;

    // Save the file to disk.
    workbook.save("sparklines1.xlsx")?;

    Ok(())
}