Chart: Simple: Simple getting started chart example
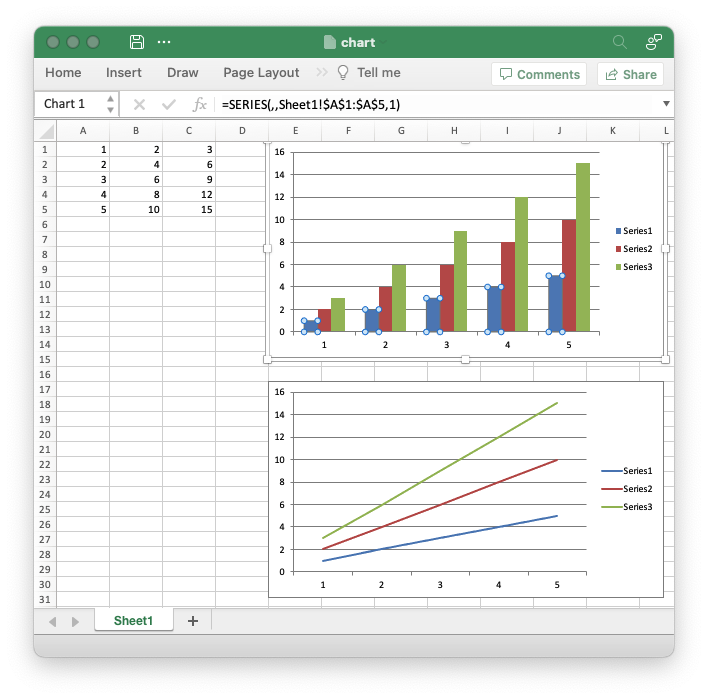
Getting started example of creating simple Excel charts.
Image of the output file:
Code to generate the output file:
// SPDX-License-Identifier: MIT OR Apache-2.0
//
// Copyright 2022-2026, John McNamara, jmcnamara@cpan.org

//! A simple chart example using the `rust_xlsxwriter` library.

use rust_xlsxwriter::{Chart, ChartType, Workbook, XlsxError};

fn main() -> Result<(), XlsxError> {
    let mut workbook = Workbook::new();
    let worksheet = workbook.add_worksheet();

    // Add some test data for the charts.
    let data = [[1, 2, 3, 4, 5], [2, 4, 6, 8, 10], [3, 6, 9, 12, 15]];
    for (col_num, col_data) in data.iter().enumerate() {
        for (row_num, row_data) in col_data.iter().enumerate() {
            worksheet.write(row_num as u32, col_num as u16, *row_data)?;
        }
    }

    // -----------------------------------------------------------------------
    // Create a new chart.
    // -----------------------------------------------------------------------
    let mut chart = Chart::new(ChartType::Column);

    // Add data series using Excel formula syntax to describe the range.
    chart.add_series().set_values("Sheet1!$A$1:$A$5");
    chart.add_series().set_values("Sheet1!$B$1:$B$5");
    chart.add_series().set_values("Sheet1!$C$1:$C$5");

    // Add the chart to the worksheet.
    worksheet.insert_chart(0, 4, &chart)?;

    // -----------------------------------------------------------------------
    // Create another chart to plot the same data as a Line chart.
    // -----------------------------------------------------------------------
    let mut chart = Chart::new(ChartType::Line);

    // Add data series to the chart using a tuple syntax to describe the range.
    // This method is better when you need to create the ranges programmatically
    // to match the data range in the worksheet.
    let row_min = 0;
    let row_max = data[0].len() as u32 - 1;
    chart
        .add_series()
        .set_values(("Sheet1", row_min, 0, row_max, 0));
    chart
        .add_series()
        .set_values(("Sheet1", row_min, 1, row_max, 1));
    chart
        .add_series()
        .set_values(("Sheet1", row_min, 2, row_max, 2));

    // Add the chart to the worksheet.
    worksheet.insert_chart(16, 4, &chart)?;

    workbook.save("chart.xlsx")?;

    Ok(())
}