Sparklines: advanced example
Example of adding sparklines to an Excel spreadsheet using the
rust_xlsxwriter library.
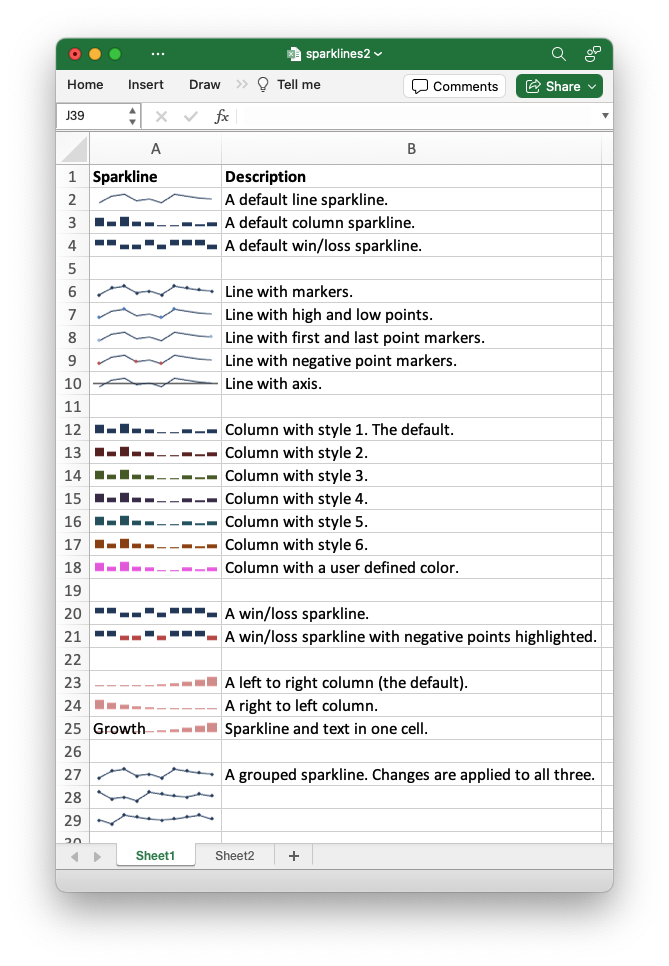
Sparklines are small charts that fit in a single cell and are used to show trends in data. This example shows the majority of options that can be applied to sparklines.
Image of the output file:
Code to generate the output file:
// SPDX-License-Identifier: MIT OR Apache-2.0
//
// Copyright 2022-2026, John McNamara, jmcnamara@cpan.org

//! Example of adding sparklines to an Excel spreadsheet using the
//! `rust_xlsxwriter` library.
//!
//! Sparklines are small charts that fit in a single cell and are used to show
//! trends in data. This example shows the majority of the properties that can
//! applied to sparklines.

use rust_xlsxwriter::{Format, Sparkline, SparklineType, Workbook, XlsxError};

fn main() -> Result<(), XlsxError> {
    // Create a new Excel file object.
    let mut workbook = Workbook::new();

    // Add a worksheet to the workbook.
    let worksheet1 = workbook.add_worksheet();
    let mut row = 1;

    // Set the columns widths to make the output clearer.
    worksheet1.set_column_width(0, 14)?;
    worksheet1.set_column_width(1, 50)?;
    worksheet1.set_zoom(150);

    // Add some headings.
    let bold = Format::new().set_bold();
    worksheet1.write_with_format(0, 0, "Sparkline", &bold)?;
    worksheet1.write_with_format(0, 1, "Description", &bold)?;

    //
    // Add a default line sparkline.
    //
    let text = "A default line sparkline.";
    worksheet1.write(row, 1, text)?;

    let sparkline = Sparkline::new().set_range(("Sheet2", 0, 0, 0, 9));

    worksheet1.add_sparkline(row, 0, &sparkline)?;
    row += 1;

    //
    // Add a default column sparkline.
    //
    let text = "A default column sparkline.";
    worksheet1.write(row, 1, text)?;

    let sparkline = Sparkline::new()
        .set_range(("Sheet2", 1, 0, 1, 9))
        .set_type(SparklineType::Column);

    worksheet1.add_sparkline(row, 0, &sparkline)?;
    row += 1;

    //
    // Add a default win/loss sparkline.
    //
    let text = "A default win/loss sparkline.";
    worksheet1.write(row, 1, text)?;

    let sparkline = Sparkline::new()
        .set_range(("Sheet2", 2, 0, 2, 9))
        .set_type(SparklineType::WinLose);

    worksheet1.add_sparkline(row, 0, &sparkline)?;
    row += 2;

    //
    // Add a line sparkline with markers.
    //
    let text = "Line with markers.";
    worksheet1.write(row, 1, text)?;

    let sparkline = Sparkline::new()
        .set_range(("Sheet2", 0, 0, 0, 9))
        .show_markers(true);

    worksheet1.add_sparkline(row, 0, &sparkline)?;
    row += 1;

    //
    // Add a line sparkline with high and low points.
    //
    let text = "Line with high and low points.";
    worksheet1.write(row, 1, text)?;

    let sparkline = Sparkline::new()
        .set_range(("Sheet2", 0, 0, 0, 9))
        .show_high_point(true)
        .show_low_point(true);

    worksheet1.add_sparkline(row, 0, &sparkline)?;
    row += 1;

    //
    // Add a line sparkline with first and last points.
    //
    let text = "Line with first and last point markers.";
    worksheet1.write(row, 1, text)?;

    let sparkline = Sparkline::new()
        .set_range(("Sheet2", 0, 0, 0, 9))
        .show_first_point(true)
        .show_last_point(true);

    worksheet1.add_sparkline(row, 0, &sparkline)?;
    row += 1;

    //
    // Add a line sparkline with negative point markers.
    //
    let text = "Line with negative point markers.";
    worksheet1.write(row, 1, text)?;

    let sparkline = Sparkline::new()
        .set_range(("Sheet2", 0, 0, 0, 9))
        .show_negative_points(true);

    worksheet1.add_sparkline(row, 0, &sparkline)?;
    row += 1;

    //
    // Add a line sparkline with axis.
    //
    let text = "Line with axis.";
    worksheet1.write(row, 1, text)?;

    let sparkline = Sparkline::new()
        .set_range(("Sheet2", 0, 0, 0, 9))
        .show_axis(true);

    worksheet1.add_sparkline(row, 0, &sparkline)?;
    row += 2;

    //
    // Add a column sparkline with style 1. The default style.
    //
    let text = "Column with style 1. The default.";
    worksheet1.write(row, 1, text)?;

    let sparkline = Sparkline::new()
        .set_range(("Sheet2", 1, 0, 1, 9))
        .set_type(SparklineType::Column)
        .set_style(1);

    worksheet1.add_sparkline(row, 0, &sparkline)?;
    row += 1;

    //
    // Add a column sparkline with style 2.
    //
    let text = "Column with style 2.";
    worksheet1.write(row, 1, text)?;

    let sparkline = Sparkline::new()
        .set_range(("Sheet2", 1, 0, 1, 9))
        .set_type(SparklineType::Column)
        .set_style(2);

    worksheet1.add_sparkline(row, 0, &sparkline)?;
    row += 1;

    //
    // Add a column sparkline with style 3.
    //
    let text = "Column with style 3.";
    worksheet1.write(row, 1, text)?;

    let sparkline = Sparkline::new()
        .set_range(("Sheet2", 1, 0, 1, 9))
        .set_type(SparklineType::Column)
        .set_style(3);

    worksheet1.add_sparkline(row, 0, &sparkline)?;
    row += 1;

    //
    // Add a column sparkline with style 4.
    //
    let text = "Column with style 4.";
    worksheet1.write(row, 1, text)?;

    let sparkline = Sparkline::new()
        .set_range(("Sheet2", 1, 0, 1, 9))
        .set_type(SparklineType::Column)
        .set_style(4);

    worksheet1.add_sparkline(row, 0, &sparkline)?;
    row += 1;

    //
    // Add a column sparkline with style 5.
    //
    let text = "Column with style 5.";
    worksheet1.write(row, 1, text)?;

    let sparkline = Sparkline::new()
        .set_range(("Sheet2", 1, 0, 1, 9))
        .set_type(SparklineType::Column)
        .set_style(5);

    worksheet1.add_sparkline(row, 0, &sparkline)?;
    row += 1;

    //
    // Add a column sparkline with style 6.
    //
    let text = "Column with style 6.";
    worksheet1.write(row, 1, text)?;

    let sparkline = Sparkline::new()
        .set_range(("Sheet2", 1, 0, 1, 9))
        .set_type(SparklineType::Column)
        .set_style(6);

    worksheet1.add_sparkline(row, 0, &sparkline)?;
    row += 1;

    //
    // Add a column sparkline with a user defined color.
    //
    let text = "Column with a user defined color.";
    worksheet1.write(row, 1, text)?;

    let sparkline = Sparkline::new()
        .set_range(("Sheet2", 1, 0, 1, 9))
        .set_type(SparklineType::Column)
        .set_sparkline_color("#E965E0");

    worksheet1.add_sparkline(row, 0, &sparkline)?;
    row += 2;

    //
    // Add a win/loss sparkline.
    //
    let text = "A win/loss sparkline.";
    worksheet1.write(row, 1, text)?;

    let sparkline = Sparkline::new()
        .set_range(("Sheet2", 2, 0, 2, 9))
        .set_type(SparklineType::WinLose);

    worksheet1.add_sparkline(row, 0, &sparkline)?;
    row += 1;

    //
    // Add a win/loss sparkline with negative points highlighted.
    //
    let text = "A win/loss sparkline with negative points highlighted.";
    worksheet1.write(row, 1, text)?;

    let sparkline = Sparkline::new()
        .set_range(("Sheet2", 2, 0, 2, 9))
        .set_type(SparklineType::WinLose)
        .show_negative_points(true);

    worksheet1.add_sparkline(row, 0, &sparkline)?;
    row += 2;

    //
    // Add a left to right (the default) sparkline.
    //
    let text = "A left to right column (the default).";
    worksheet1.write(row, 1, text)?;

    let sparkline = Sparkline::new()
        .set_range(("Sheet2", 3, 0, 3, 9))
        .set_type(SparklineType::Column)
        .set_style(20);

    worksheet1.add_sparkline(row, 0, &sparkline)?;
    row += 1;

    //
    // Add a right to left sparkline.
    //
    let text = "A right to left column.";
    worksheet1.write(row, 1, text)?;

    let sparkline = Sparkline::new()
        .set_range(("Sheet2", 3, 0, 3, 9))
        .set_type(SparklineType::Column)
        .set_style(20)
        .set_right_to_left(true);

    worksheet1.add_sparkline(row, 0, &sparkline)?;
    row += 1;

    //
    // Sparkline and text in one cell. This just requires writing text to the
    // same cell as the sparkline.
    //
    let text = "Sparkline and text in one cell.";
    worksheet1.write(row, 1, text)?;

    let sparkline = Sparkline::new()
        .set_range(("Sheet2", 3, 0, 3, 9))
        .set_type(SparklineType::Column)
        .set_style(20);

    worksheet1.add_sparkline(row, 0, &sparkline)?;
    worksheet1.write(row, 0, "Growth")?;
    row += 2;

    //
    // "A grouped sparkline. User changes are applied to all three. Not that the
    // sparkline range is a 2D range and the sparkline is positioned in a 1D
    // range of cells.
    //
    let text = "A grouped sparkline. Changes are applied to all three.";
    worksheet1.write(row, 1, text)?;

    let sparkline = Sparkline::new()
        .set_range(("Sheet2", 4, 0, 6, 9))
        .show_markers(true);

    worksheet1.add_sparkline_group(row, 0, row + 2, 0, &sparkline)?;

    //
    // Add a worksheet with the data to plot on a separate worksheet.
    //
    let worksheet2 = workbook.add_worksheet();

    // Some sample data to plot.
    let data = [
        // Simple line data.
        [-2, 2, 3, -1, 0, -2, 3, 2, 1, 0],
        // Simple column data.
        [30, 20, 33, 20, 15, 5, 5, 15, 10, 15],
        // Simple win/loss data.
        [1, 1, -1, -1, 1, -1, 1, 1, 1, -1],
        // Unbalanced histogram.
        [5, 6, 7, 10, 15, 20, 30, 50, 70, 100],
        // Data for the grouped sparkline example.
        [-2, 2, 3, -1, 0, -2, 3, 2, 1, 0],
        [3, -1, 0, -2, 3, 2, 1, 0, 2, 1],
        [0, -2, 3, 2, 1, 0, 1, 2, 3, 1],
    ];

    worksheet2.write_row_matrix(0, 0, data)?;

    // Save the file to disk.
    workbook.save("sparklines2.xlsx")?;

    Ok(())
}