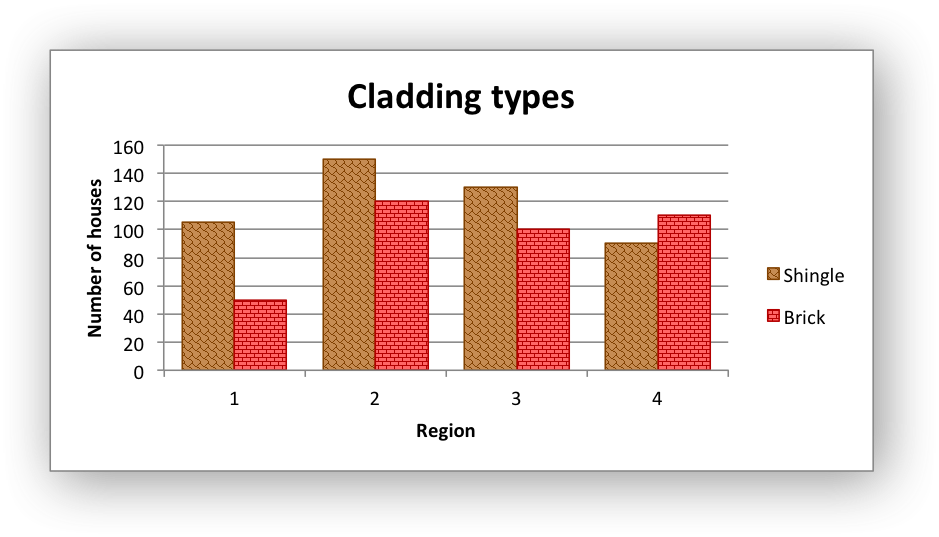
Chart: Pattern Fill: Example of a chart with Pattern Fill
A example of creating column charts with fill patterns using the ChartFormat
and ChartPatternFill structs.
Image of the output file:
Code to generate the output file:
// SPDX-License-Identifier: MIT OR Apache-2.0
//
// Copyright 2022-2026, John McNamara, jmcnamara@cpan.org

//! An example of creating column charts with fill patterns using the
//! `rust_xlsxwriter` library.

use rust_xlsxwriter::*;

fn main() -> Result<(), XlsxError> {
    let mut workbook = Workbook::new();
    let worksheet = workbook.add_worksheet();
    let bold = Format::new().set_bold();

    // Add the worksheet data that the charts will refer to.
    worksheet.write_with_format(0, 0, "Shingle", &bold)?;
    worksheet.write_with_format(0, 1, "Brick", &bold)?;

    let data = [[105, 150, 130, 90], [50, 120, 100, 110]];
    for (col_num, col_data) in data.iter().enumerate() {
        for (row_num, row_data) in col_data.iter().enumerate() {
            worksheet.write(row_num as u32 + 1, col_num as u16, *row_data)?;
        }
    }

    // Create a new column chart.
    let mut chart = Chart::new(ChartType::Column);

    // Configure the first data series and add fill patterns.
    chart
        .add_series()
        .set_name("Sheet1!$A$1")
        .set_values("Sheet1!$A$2:$A$5")
        .set_gap(70)
        .set_format(
            ChartFormat::new()
                .set_pattern_fill(
                    ChartPatternFill::new()
                        .set_pattern(ChartPatternFillType::Shingle)
                        .set_foreground_color("#804000")
                        .set_background_color("#C68C53"),
                )
                .set_border(ChartLine::new().set_color("#804000")),
        );

    chart
        .add_series()
        .set_name("Sheet1!$B$1")
        .set_values("Sheet1!$B$2:$B$5")
        .set_format(
            ChartFormat::new()
                .set_pattern_fill(
                    ChartPatternFill::new()
                        .set_pattern(ChartPatternFillType::HorizontalBrick)
                        .set_foreground_color("#B30000")
                        .set_background_color("#FF6666"),
                )
                .set_border(ChartLine::new().set_color("#B30000")),
        );

    // Add a chart title and some axis labels.
    chart.title().set_name("Cladding types");
    chart.x_axis().set_name("Region");
    chart.y_axis().set_name("Number of houses");

    // Add the chart to the worksheet.
    worksheet.insert_chart(1, 3, &chart)?;

    workbook.save("chart_pattern.xlsx")?;

    Ok(())
}