Chart: Pie: Excel Pie chart example
Example of creating Excel Pie charts.
Image of the output file:
Chart 1 in the following example is a default pie chart:
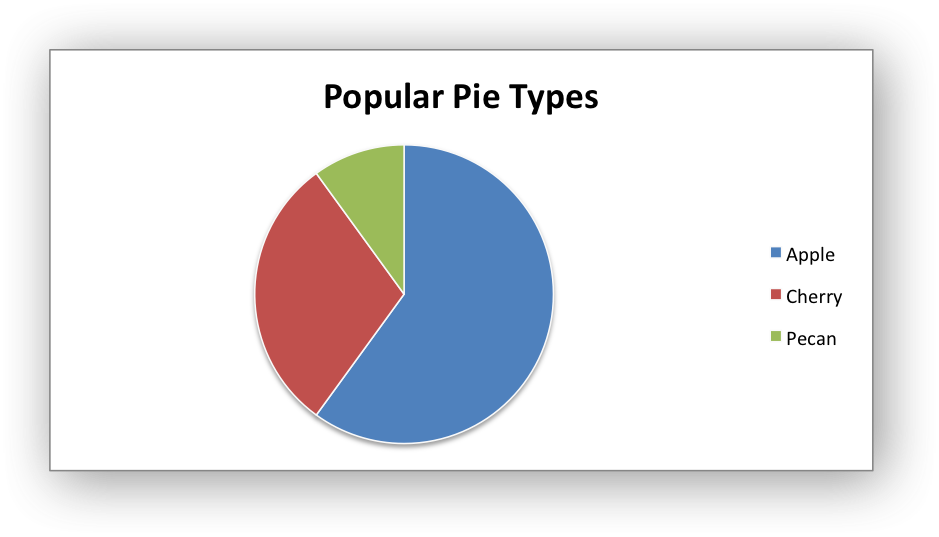
Chart 2 shows how to set segment colors.
It is possible to define chart colors for most types of rust_xlsxwritercharts via
the add_series() method. However, Pie charts are a special case since each
segment is represented as a point and as such it is necessary to assign
formatting to each point in the series.
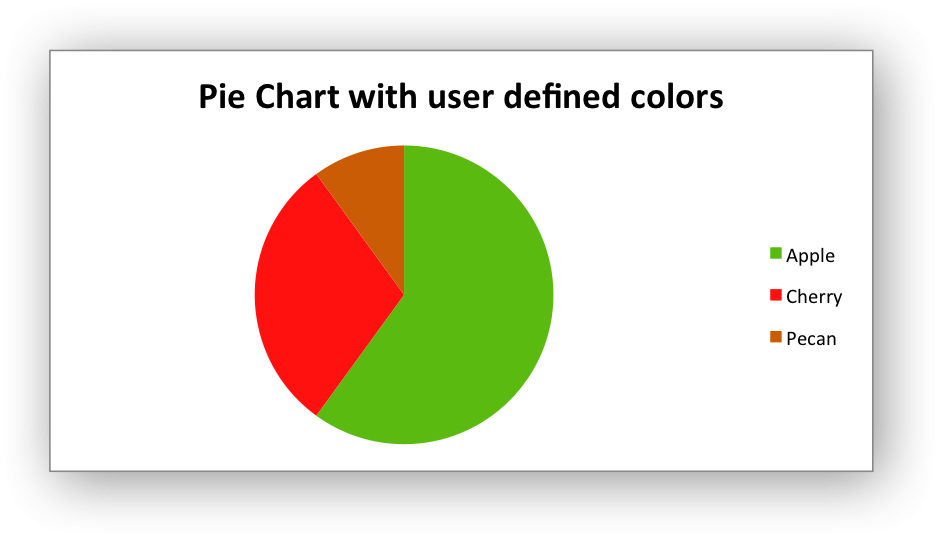
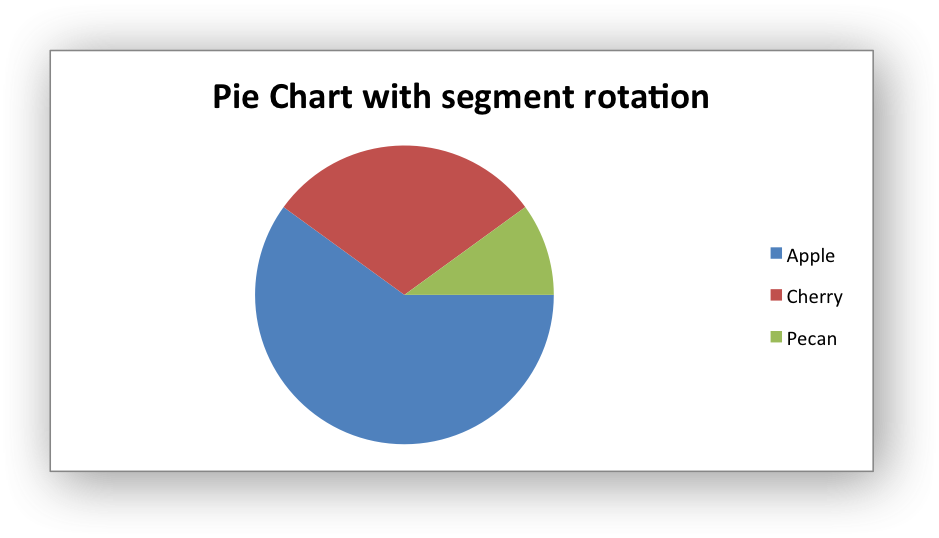
Chart 3 shows how to rotate the segments of the chart:
Code to generate the output file:
// SPDX-License-Identifier: MIT OR Apache-2.0
//
// Copyright 2022-2026, John McNamara, jmcnamara@cpan.org

//! An example of creating pie charts using the `rust_xlsxwriter` library.

use rust_xlsxwriter::{Chart, Format, Workbook, XlsxError};

fn main() -> Result<(), XlsxError> {
    let mut workbook = Workbook::new();
    let worksheet = workbook.add_worksheet();
    let bold = Format::new().set_bold();

    // Add the worksheet data that the charts will refer to.
    worksheet.write_with_format(0, 0, "Category", &bold)?;
    worksheet.write_with_format(0, 1, "Values", &bold)?;

    worksheet.write(1, 0, "Apple")?;
    worksheet.write(2, 0, "Cherry")?;
    worksheet.write(3, 0, "Pecan")?;

    worksheet.write(1, 1, 60)?;
    worksheet.write(2, 1, 30)?;
    worksheet.write(3, 1, 10)?;

    // -----------------------------------------------------------------------
    // Create a new pie chart.
    // -----------------------------------------------------------------------
    let mut chart = Chart::new_pie();

    // Configure the data series for the chart.
    chart
        .add_series()
        .set_categories("Sheet1!$A$2:$A$4")
        .set_values("Sheet1!$B$2:$B$4")
        .set_name("Pie sales data");

    // Add a chart title.
    chart.title().set_name("Popular Pie Types");

    // Set an Excel chart style.
    chart.set_style(10);

    // Add the chart to the worksheet.
    worksheet.insert_chart_with_offset(1, 2, &chart, 25, 10)?;

    // -----------------------------------------------------------------------
    // Create a Pie chart with user defined segment colors.
    // -----------------------------------------------------------------------
    let mut chart = Chart::new_pie();

    // Configure the data series for the chart.
    chart
        .add_series()
        .set_categories("Sheet1!$A$2:$A$4")
        .set_values("Sheet1!$B$2:$B$4")
        .set_name("Pie sales data")
        .set_point_colors(&["#5ABA10", "#FE110E", "#CA5C05"]);

    // Add a chart title.
    chart.title().set_name("Pie Chart with user defined colors");

    // Add the chart to the worksheet.
    worksheet.insert_chart_with_offset(17, 2, &chart, 25, 10)?;

    // -----------------------------------------------------------------------
    // Create a Pie chart with rotation of the segments.
    // -----------------------------------------------------------------------
    let mut chart = Chart::new_pie();

    // Configure the data series for the chart.
    chart
        .add_series()
        .set_categories("Sheet1!$A$2:$A$4")
        .set_values("Sheet1!$B$2:$B$4")
        .set_name("Pie sales data");

    // Change the angle/rotation of the first segment.
    chart.set_rotation(90);

    // Add a chart title.
    chart.title().set_name("Pie Chart with segment rotation");

    // Add the chart to the worksheet.
    worksheet.insert_chart_with_offset(33, 2, &chart, 25, 10)?;

    workbook.save("chart_pie.xlsx")?;

    Ok(())
}