Chart: Stock: Excel Stock chart example
Example of creating Excel Stock charts.
Note, Volume variants of the Excel stock charts aren't currently supported but will be in a future release.
Image of the output file:
Chart 1 in the following example is an example of a High-Low-Close Stock chart.
To create a chart similar to a default Excel High-Low-Close Stock chart you need to do the following steps:
- Create a
Stocktype chart. - Add 3 series for High, Low and Close, in that order.
- Hide the default lines in all 3 series.
- Hide the default markers for the High and Low series.
- Set a dash marker for the Close series.
- Turn on the chart High-Low bars.
- Format any other chart or axis property you need.
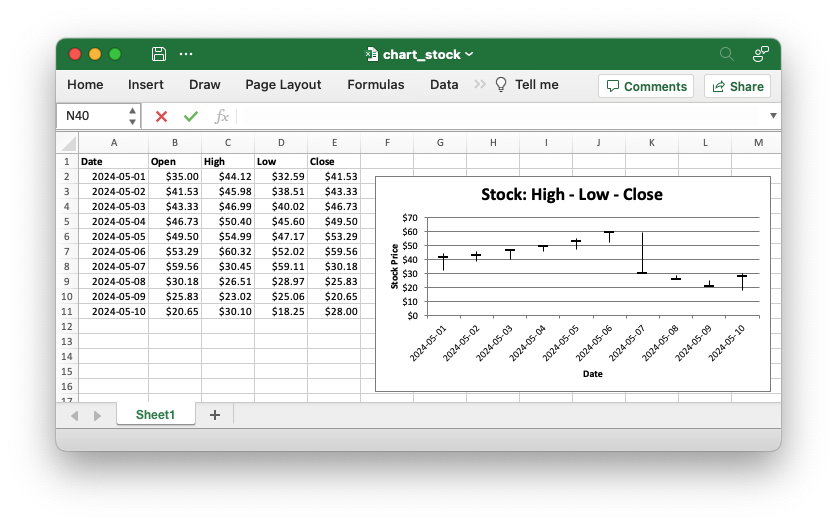
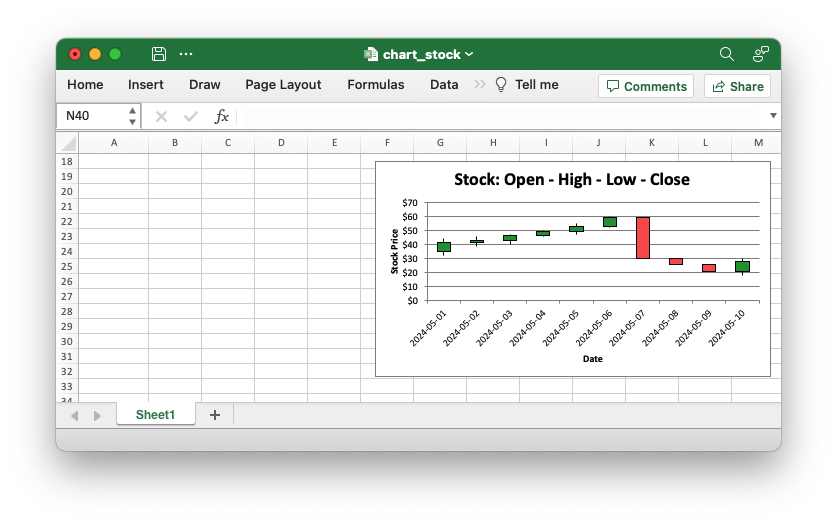
Chart 2 in the following example is an example of an Open-High-Low-Close Stock chart.
To create a chart similar to a default Excel Open-High-Low-Close Stock chart you need to do the following steps:
- Create a
Stocktype chart. - Add 4 series for Open, High, Low and Close, in that order.
- Hide the default lines in all 4 series.
- Turn on the chart High-Low bars.
- Turn on the chart Up-Down bars.
- Format any other chart or axis property you need.
Code to generate the output file:
// SPDX-License-Identifier: MIT OR Apache-2.0
//
// Copyright 2022-2026, John McNamara, jmcnamara@cpan.org

//! An example of creating Stock charts using the `rust_xlsxwriter` library.
//!
//! Note, Volume variants of the Excel stock charts aren't currently supported
//! but will be in a future release.

use rust_xlsxwriter::{
    Chart, ChartFormat, ChartLine, ChartMarker, ChartMarkerType, ChartSolidFill, ChartType,
    ExcelDateTime, Format, Workbook, XlsxError,
};

fn main() -> Result<(), XlsxError> {
    let mut workbook = Workbook::new();
    let worksheet = workbook.add_worksheet();

    // Create some formatting to use for the worksheet data.
    let bold = Format::new().set_bold();
    let date_format = Format::new().set_num_format("yyyy-mm-dd");
    let money_format = Format::new().set_num_format("[$$-en-US]#,##0.00");

    // -----------------------------------------------------------------------
    // Create some simulated stock data for the chart.
    //
    let dates = [
        "2024-05-01",
        "2024-05-02",
        "2024-05-03",
        "2024-05-04",
        "2024-05-05",
        "2024-05-06",
        "2024-05-07",
        "2024-05-08",
        "2024-05-09",
        "2024-05-10",
    ];

    // Map the string dates to ExcelDateTime objects, while capturing any
    // potential conversion errors.
    let dates: Result<Vec<ExcelDateTime>, XlsxError> = dates
        .into_iter()
        .map(ExcelDateTime::parse_from_str)
        .collect();
    let dates = dates?;

    let open_data = [
        35.00, 41.53, 43.33, 46.73, 49.50, 53.29, 59.56, 30.18, 25.83, 20.65,
    ];

    let high_data = [
        44.12, 45.98, 46.99, 50.40, 54.99, 60.32, 30.45, 26.51, 23.02, 30.10,
    ];

    let low_low = [
        32.59, 38.51, 40.02, 45.60, 47.17, 52.02, 59.11, 28.97, 25.06, 18.25,
    ];

    let close_data = [
        41.53, 43.33, 46.73, 49.50, 53.29, 59.56, 30.18, 25.83, 20.65, 28.00,
    ];

    // -----------------------------------------------------------------------
    // Define variables so that the chart can change dynamically with the data.
    //
    let header_row = 0;
    let start_row = header_row + 1;
    let end_row = start_row + (dates.len() as u32) - 1;
    let date_col = 0;
    let open_col = date_col + 1;
    let high_col = date_col + 2;
    let low_col = date_col + 3;
    let close_col = date_col + 4;

    // -----------------------------------------------------------------------
    // Write the data to the worksheet, with formatting.
    //
    worksheet.write_with_format(header_row, date_col, "Date", &bold)?;
    worksheet.write_with_format(header_row, open_col, "Open", &bold)?;
    worksheet.write_with_format(header_row, high_col, "High", &bold)?;
    worksheet.write_with_format(header_row, low_col, "Low", &bold)?;
    worksheet.write_with_format(header_row, close_col, "Close", &bold)?;

    worksheet.write_column_with_format(start_row, date_col, dates, &date_format)?;
    worksheet.write_column_with_format(start_row, open_col, open_data, &money_format)?;
    worksheet.write_column_with_format(start_row, high_col, high_data, &money_format)?;
    worksheet.write_column_with_format(start_row, low_col, low_low, &money_format)?;
    worksheet.write_column_with_format(start_row, close_col, close_data, &money_format)?;

    // Change the width of the date column, for clarity.
    worksheet.set_column_width(date_col, 11)?;

    // -----------------------------------------------------------------------
    // Create a new High-Low-Close Stock chart.
    //
    // To create a chart similar to a default Excel High-Low-Close Stock chart
    // you need to do the following steps:
    //
    // 1. Create a `Stock` type chart.
    // 2. Add 3 series for High, Low and Close, in that order.
    // 3. Hide the default lines in all 3 series.
    // 4. Hide the default markers for the High and Low series.
    // 5. Set a dash marker for the Close series.
    // 6. Turn on the chart High-Low bars.
    // 7. Format any other chart or axis property you need.
    //
    let mut chart = Chart::new(ChartType::Stock);

    // Add the High series.
    chart
        .add_series()
        .set_categories(("Sheet1", start_row, date_col, end_row, date_col))
        .set_values(("Sheet1", start_row, high_col, end_row, high_col))
        .set_format(ChartLine::new().set_hidden(true))
        .set_marker(ChartMarker::new().set_none());

    // Add the Low series.
    chart
        .add_series()
        .set_categories(("Sheet1", start_row, date_col, end_row, date_col))
        .set_values(("Sheet1", start_row, low_col, end_row, low_col))
        .set_format(ChartLine::new().set_hidden(true))
        .set_marker(ChartMarker::new().set_none());

    // Add the Close series.
    chart
        .add_series()
        .set_categories(("Sheet1", start_row, date_col, end_row, date_col))
        .set_values(("Sheet1", start_row, close_col, end_row, close_col))
        .set_format(ChartLine::new().set_hidden(true))
        .set_marker(
            ChartMarker::new()
                .set_type(ChartMarkerType::LongDash)
                .set_size(10)
                .set_format(
                    ChartFormat::new()
                        .set_border(ChartLine::new().set_color("#000000"))
                        .set_solid_fill(ChartSolidFill::new().set_color("#000000")),
                ),
        );

    // Set the High-Low lines.
    chart.set_high_low_lines(true);

    // Add a chart title and some axis labels.
    chart.title().set_name("Stock: High - Low - Close");
    chart.x_axis().set_name("Date");
    chart.y_axis().set_name("Stock Price");

    // Format the price axis number format.
    chart.y_axis().set_num_format("[$$-en-US]#,##0");

    // Turn off the chart legend.
    chart.legend().set_hidden();

    // Insert the chart into the worksheet.
    worksheet.insert_chart_with_offset(start_row, close_col + 1, &chart, 20, 10)?;

    // -----------------------------------------------------------------------
    // Create a new Open-High-Low-Close Stock chart.
    //
    // To create a chart similar to a default Excel Open-High-Low-Close Stock
    // chart you need to do the following steps:
    //
    // 1. Create a `Stock` type chart.
    // 2. Add 4 series for Open, High, Low and Close, in that order.
    // 3. Hide the default lines in all 4 series.
    // 4. Turn on the chart High-Low bars.
    // 5. Turn on the chart Up-Down bars.
    // 6. Format any other chart or axis property you need.
    //
    let mut chart = Chart::new(ChartType::Stock);

    // Add the Open series.
    chart
        .add_series()
        .set_categories(("Sheet1", start_row, date_col, end_row, date_col))
        .set_values(("Sheet1", start_row, open_col, end_row, open_col))
        .set_format(ChartLine::new().set_hidden(true))
        .set_marker(ChartMarker::new().set_none());

    // Add the High series.
    chart
        .add_series()
        .set_categories(("Sheet1", start_row, date_col, end_row, date_col))
        .set_values(("Sheet1", start_row, high_col, end_row, high_col))
        .set_format(ChartLine::new().set_hidden(true))
        .set_marker(ChartMarker::new().set_none());

    // Add the Low series.
    chart
        .add_series()
        .set_categories(("Sheet1", start_row, date_col, end_row, date_col))
        .set_values(("Sheet1", start_row, low_col, end_row, low_col))
        .set_format(ChartLine::new().set_hidden(true))
        .set_marker(ChartMarker::new().set_none());

    // Add the Close series.
    chart
        .add_series()
        .set_categories(("Sheet1", start_row, date_col, end_row, date_col))
        .set_values(("Sheet1", start_row, close_col, end_row, close_col))
        .set_format(ChartLine::new().set_hidden(true))
        .set_marker(ChartMarker::new().set_none());

    // Set the High-Low lines.
    chart.set_high_low_lines(true);

    // Turn on and format the Up-Down bars.
    chart.set_up_down_bars(true);
    chart.set_up_bar_format(ChartSolidFill::new().set_color("#009933"));
    chart.set_down_bar_format(ChartSolidFill::new().set_color("#FF5050"));

    // Add a chart title and some axis labels.
    chart.title().set_name("Stock: Open - High - Low - Close");
    chart.x_axis().set_name("Date");
    chart.y_axis().set_name("Stock Price");

    // Format the price axis number format.
    chart.y_axis().set_num_format("[$$-en-US]#,##0");

    // Turn off the chart legend.
    chart.legend().set_hidden();

    // Insert the chart into the worksheet.
    worksheet.insert_chart_with_offset(start_row + 16, close_col + 1, &chart, 20, 10)?;

    // -----------------------------------------------------------------------
    // Save and close the file.
    // -----------------------------------------------------------------------
    workbook.save("chart_stock.xlsx")?;

    Ok(())
}