Making the code more programmatic
The previous example worked as expected but it contains some hard-coded cell
ranges like set_values("Sheet1!$B$2:$B$5") and Formula::new("=SUM(B2:B5)").
If our example changed to have a different number of data items then we would
have to manually change the code to adjust for the new ranges.
Fortunately, these hard-coded values are only used for the sake of a tutorial and
rust_xlsxwriter provides APIs to handle these more programmatically.
Let's start by looking at the chart ranges:
// SPDX-License-Identifier: MIT OR Apache-2.0
//
// Copyright 2022-2026, John McNamara, jmcnamara@cpan.org

//! A simple program to write some data to an Excel spreadsheet using
//! `rust_xlsxwriter`. Part 4 of a tutorial.

use rust_xlsxwriter::{Chart, ExcelDateTime, Format, Formula, Workbook, XlsxError};

fn main() -> Result<(), XlsxError> {
    // Some sample data we want to write to a spreadsheet.
    let expenses = vec![
        ("Rent", 2000, "2022-09-01"),
        ("Gas", 200, "2022-09-05"),
        ("Food", 500, "2022-09-21"),
        ("Gym", 100, "2022-09-28"),
    ];

    // Create a new Excel file object.
    let mut workbook = Workbook::new();

    // Add a bold format to use to highlight cells.
    let bold = Format::new().set_bold();

    // Add a number format for cells with money values.
    let money_format = Format::new().set_num_format("$#,##0");

    // Add a number format for cells with dates.
    let date_format = Format::new().set_num_format("d mmm yyyy");

    // Add a worksheet to the workbook.
    let worksheet = workbook.add_worksheet();

    // Write some column headers.
    worksheet.write_with_format(0, 0, "Item", &bold)?;
    worksheet.write_with_format(0, 1, "Cost", &bold)?;
    worksheet.write_with_format(0, 2, "Date", &bold)?;

    // Adjust the date column width for clarity.
    worksheet.set_column_width(2, 15)?;

    // Iterate over the data and write it out row by row.
    let mut last_row = 1;
    for expense in &expenses {
        worksheet.write(last_row, 0, expense.0)?;
        worksheet.write_with_format(last_row, 1, expense.1, &money_format)?;

        let date = ExcelDateTime::parse_from_str(expense.2)?;
        worksheet.write_with_format(last_row, 2, &date, &date_format)?;

        last_row += 1;
    }

    // Write a total using a formula.
    worksheet.write_with_format(last_row, 0, "Total", &bold)?;
    worksheet.write_with_format(last_row, 1, Formula::new("=SUM(B2:B5)"), &money_format)?;

    // Add a chart to display the expenses.
    let mut chart = Chart::new_pie();

    // Configure the data series for the chart.
    chart
        .add_series()
        .set_categories("Sheet1!$A$2:$A$5")
        .set_values("Sheet1!$B$2:$B$5");

    // Add the chart to the worksheet.
    worksheet.insert_chart(1, 4, &chart)?;

    // Save the file to disk.
    workbook.save("tutorial4.xlsx")?;

    Ok(())
}
In general rust_xlsxwriter always numeric APIs for any ranges in Excel but
sometimes also provides a secondary string based option. The previous
example uses the secondary string based API for demonstration purposes but for
real applications you would set the chart ranges we can using 5-tuple values
like this:
// SPDX-License-Identifier: MIT OR Apache-2.0
//
// Copyright 2022-2026, John McNamara, jmcnamara@cpan.org

//! A simple program to write some data to an Excel spreadsheet using
//! `rust_xlsxwriter`. Part 5 of a tutorial.

use rust_xlsxwriter::{cell_range, Chart, ExcelDateTime, Format, Formula, Workbook, XlsxError};

fn main() -> Result<(), XlsxError> {
    // Some sample data we want to write to a spreadsheet.
    let expenses = vec![
        ("Rent", 2000, "2022-09-01"),
        ("Gas", 200, "2022-09-05"),
        ("Food", 500, "2022-09-21"),
        ("Gym", 100, "2022-09-28"),
    ];

    // Create a new Excel file object.
    let mut workbook = Workbook::new();

    // Add a bold format to use to highlight cells.
    let bold = Format::new().set_bold();

    // Add a number format for cells with money values.
    let money_format = Format::new().set_num_format("$#,##0");

    // Add a number format for cells with dates.
    let date_format = Format::new().set_num_format("d mmm yyyy");

    // Add a worksheet to the workbook.
    let worksheet = workbook.add_worksheet();

    // Write some column headers.
    worksheet.write_with_format(0, 0, "Item", &bold)?;
    worksheet.write_with_format(0, 1, "Cost", &bold)?;
    worksheet.write_with_format(0, 2, "Date", &bold)?;

    // Adjust the date column width for clarity.
    worksheet.set_column_width(2, 15)?;

    // Iterate over the data and write it out row by row.
    let mut row = 1;
    for expense in &expenses {
        worksheet.write(row, 0, expense.0)?;
        worksheet.write_with_format(row, 1, expense.1, &money_format)?;

        let date = ExcelDateTime::parse_from_str(expense.2)?;
        worksheet.write_with_format(row, 2, &date, &date_format)?;

        row += 1;
    }

    // For clarity, define some variables to use in the formula and chart
    // ranges. Row and column numbers are all zero-indexed.
    let first_row = 1; // Skip the header row.
    let last_row = first_row + (expenses.len() as u32) - 1;
    let item_col = 0;
    let cost_col = 1;

    // Write a total using a formula.
    worksheet.write_with_format(row, 0, "Total", &bold)?;

    let range = cell_range(first_row, cost_col, last_row, cost_col);
    let formula = format!("=SUM({range})");
    worksheet.write_with_format(row, 1, Formula::new(formula), &money_format)?;

    // Add a chart to display the expenses.
    let mut chart = Chart::new_pie();

    // Configure the data series for the chart.
    chart
        .add_series()
        .set_categories(("Sheet1", first_row, item_col, last_row, item_col))
        .set_values(("Sheet1", first_row, cost_col, last_row, cost_col));

    // Add the chart to the worksheet.
    worksheet.insert_chart(1, 4, &chart)?;

    // Save the file to disk.
    workbook.save("tutorial5.xlsx")?;

    Ok(())
}
Where the range values are set or calculated in the code:
// SPDX-License-Identifier: MIT OR Apache-2.0
//
// Copyright 2022-2026, John McNamara, jmcnamara@cpan.org

//! A simple program to write some data to an Excel spreadsheet using
//! `rust_xlsxwriter`. Part 5 of a tutorial.

use rust_xlsxwriter::{cell_range, Chart, ExcelDateTime, Format, Formula, Workbook, XlsxError};

fn main() -> Result<(), XlsxError> {
    // Some sample data we want to write to a spreadsheet.
    let expenses = vec![
        ("Rent", 2000, "2022-09-01"),
        ("Gas", 200, "2022-09-05"),
        ("Food", 500, "2022-09-21"),
        ("Gym", 100, "2022-09-28"),
    ];

    // Create a new Excel file object.
    let mut workbook = Workbook::new();

    // Add a bold format to use to highlight cells.
    let bold = Format::new().set_bold();

    // Add a number format for cells with money values.
    let money_format = Format::new().set_num_format("$#,##0");

    // Add a number format for cells with dates.
    let date_format = Format::new().set_num_format("d mmm yyyy");

    // Add a worksheet to the workbook.
    let worksheet = workbook.add_worksheet();

    // Write some column headers.
    worksheet.write_with_format(0, 0, "Item", &bold)?;
    worksheet.write_with_format(0, 1, "Cost", &bold)?;
    worksheet.write_with_format(0, 2, "Date", &bold)?;

    // Adjust the date column width for clarity.
    worksheet.set_column_width(2, 15)?;

    // Iterate over the data and write it out row by row.
    let mut row = 1;
    for expense in &expenses {
        worksheet.write(row, 0, expense.0)?;
        worksheet.write_with_format(row, 1, expense.1, &money_format)?;

        let date = ExcelDateTime::parse_from_str(expense.2)?;
        worksheet.write_with_format(row, 2, &date, &date_format)?;

        row += 1;
    }

    // For clarity, define some variables to use in the formula and chart
    // ranges. Row and column numbers are all zero-indexed.
    let first_row = 1; // Skip the header row.
    let last_row = first_row + (expenses.len() as u32) - 1;
    let item_col = 0;
    let cost_col = 1;

    // Write a total using a formula.
    worksheet.write_with_format(row, 0, "Total", &bold)?;

    let range = cell_range(first_row, cost_col, last_row, cost_col);
    let formula = format!("=SUM({range})");
    worksheet.write_with_format(row, 1, Formula::new(formula), &money_format)?;

    // Add a chart to display the expenses.
    let mut chart = Chart::new_pie();

    // Configure the data series for the chart.
    chart
        .add_series()
        .set_categories(("Sheet1", first_row, item_col, last_row, item_col))
        .set_values(("Sheet1", first_row, cost_col, last_row, cost_col));

    // Add the chart to the worksheet.
    worksheet.insert_chart(1, 4, &chart)?;

    // Save the file to disk.
    workbook.save("tutorial5.xlsx")?;

    Ok(())
}
This allows the range to change dynamically if we add new elements to our data
vector and also ensures that the worksheet name is quoted properly, if required.
The other section of the code that has a hard-coded string is the formula
"=SUM(B2:B5)". There isn't a single API change that can be applied to ranges
in formulas but rust_xlsxwriter provides several utility functions that can
convert numbers to string ranges. For example the
cell_range() function which takes zero indexed
numbers and converts them to a string range like B2:B5:
// SPDX-License-Identifier: MIT OR Apache-2.0
//
// Copyright 2022-2026, John McNamara, jmcnamara@cpan.org

//! A simple program to write some data to an Excel spreadsheet using
//! `rust_xlsxwriter`. Part 5 of a tutorial.

use rust_xlsxwriter::{cell_range, Chart, ExcelDateTime, Format, Formula, Workbook, XlsxError};

fn main() -> Result<(), XlsxError> {
    // Some sample data we want to write to a spreadsheet.
    let expenses = vec![
        ("Rent", 2000, "2022-09-01"),
        ("Gas", 200, "2022-09-05"),
        ("Food", 500, "2022-09-21"),
        ("Gym", 100, "2022-09-28"),
    ];

    // Create a new Excel file object.
    let mut workbook = Workbook::new();

    // Add a bold format to use to highlight cells.
    let bold = Format::new().set_bold();

    // Add a number format for cells with money values.
    let money_format = Format::new().set_num_format("$#,##0");

    // Add a number format for cells with dates.
    let date_format = Format::new().set_num_format("d mmm yyyy");

    // Add a worksheet to the workbook.
    let worksheet = workbook.add_worksheet();

    // Write some column headers.
    worksheet.write_with_format(0, 0, "Item", &bold)?;
    worksheet.write_with_format(0, 1, "Cost", &bold)?;
    worksheet.write_with_format(0, 2, "Date", &bold)?;

    // Adjust the date column width for clarity.
    worksheet.set_column_width(2, 15)?;

    // Iterate over the data and write it out row by row.
    let mut row = 1;
    for expense in &expenses {
        worksheet.write(row, 0, expense.0)?;
        worksheet.write_with_format(row, 1, expense.1, &money_format)?;

        let date = ExcelDateTime::parse_from_str(expense.2)?;
        worksheet.write_with_format(row, 2, &date, &date_format)?;

        row += 1;
    }

    // For clarity, define some variables to use in the formula and chart
    // ranges. Row and column numbers are all zero-indexed.
    let first_row = 1; // Skip the header row.
    let last_row = first_row + (expenses.len() as u32) - 1;
    let item_col = 0;
    let cost_col = 1;

    // Write a total using a formula.
    worksheet.write_with_format(row, 0, "Total", &bold)?;

    let range = cell_range(first_row, cost_col, last_row, cost_col);
    let formula = format!("=SUM({range})");
    worksheet.write_with_format(row, 1, Formula::new(formula), &money_format)?;

    // Add a chart to display the expenses.
    let mut chart = Chart::new_pie();

    // Configure the data series for the chart.
    chart
        .add_series()
        .set_categories(("Sheet1", first_row, item_col, last_row, item_col))
        .set_values(("Sheet1", first_row, cost_col, last_row, cost_col));

    // Add the chart to the worksheet.
    worksheet.insert_chart(1, 4, &chart)?;

    // Save the file to disk.
    workbook.save("tutorial5.xlsx")?;

    Ok(())
}
Reading ahead:
The
cell_range()function and other similar functions are detailed elsewhere in the documentation:
column_number_to_name()- Convert a zero indexed column cell reference to a string like"A".column_name_to_number()- Convert a column string such as"A"to a zero indexed column reference.row_col_to_cell()- Convert zero indexed row and column cell numbers to aA1style string.row_col_to_cell_absolute()- Convert zero indexed row and column cell numbers to an absolute$A$1style range string.cell_range()- Convert zero indexed row and col cell numbers to aA1:B1style range string.cell_range_absolute()- Convert zero indexed row and col cell numbers to an absolute$A$1:$B$1
Adding these improvements our application changes to the following:
// SPDX-License-Identifier: MIT OR Apache-2.0
//
// Copyright 2022-2026, John McNamara, jmcnamara@cpan.org
//! A simple program to write some data to an Excel spreadsheet using
//! `rust_xlsxwriter`. Part 5 of a tutorial.
use rust_xlsxwriter::{cell_range, Chart, ExcelDateTime, Format, Formula, Workbook, XlsxError};
fn main() -> Result<(), XlsxError> {
// Some sample data we want to write to a spreadsheet.
let expenses = vec![
("Rent", 2000, "2022-09-01"),
("Gas", 200, "2022-09-05"),
("Food", 500, "2022-09-21"),
("Gym", 100, "2022-09-28"),
];
// Create a new Excel file object.
let mut workbook = Workbook::new();
// Add a bold format to use to highlight cells.
let bold = Format::new().set_bold();
// Add a number format for cells with money values.
let money_format = Format::new().set_num_format("$#,##0");
// Add a number format for cells with dates.
let date_format = Format::new().set_num_format("d mmm yyyy");
// Add a worksheet to the workbook.
let worksheet = workbook.add_worksheet();
// Write some column headers.
worksheet.write_with_format(0, 0, "Item", &bold)?;
worksheet.write_with_format(0, 1, "Cost", &bold)?;
worksheet.write_with_format(0, 2, "Date", &bold)?;
// Adjust the date column width for clarity.
worksheet.set_column_width(2, 15)?;
// Iterate over the data and write it out row by row.
let mut row = 1;
for expense in &expenses {
worksheet.write(row, 0, expense.0)?;
worksheet.write_with_format(row, 1, expense.1, &money_format)?;
let date = ExcelDateTime::parse_from_str(expense.2)?;
worksheet.write_with_format(row, 2, &date, &date_format)?;
row += 1;
}
// For clarity, define some variables to use in the formula and chart
// ranges. Row and column numbers are all zero-indexed.
let first_row = 1; // Skip the header row.
let last_row = first_row + (expenses.len() as u32) - 1;
let item_col = 0;
let cost_col = 1;
// Write a total using a formula.
worksheet.write_with_format(row, 0, "Total", &bold)?;
let range = cell_range(first_row, cost_col, last_row, cost_col);
let formula = format!("=SUM({range})");
worksheet.write_with_format(row, 1, Formula::new(formula), &money_format)?;
// Add a chart to display the expenses.
let mut chart = Chart::new_pie();
// Configure the data series for the chart.
chart
.add_series()
.set_categories(("Sheet1", first_row, item_col, last_row, item_col))
.set_values(("Sheet1", first_row, cost_col, last_row, cost_col));
// Add the chart to the worksheet.
worksheet.insert_chart(1, 4, &chart)?;
// Save the file to disk.
workbook.save("tutorial5.xlsx")?;
Ok(())
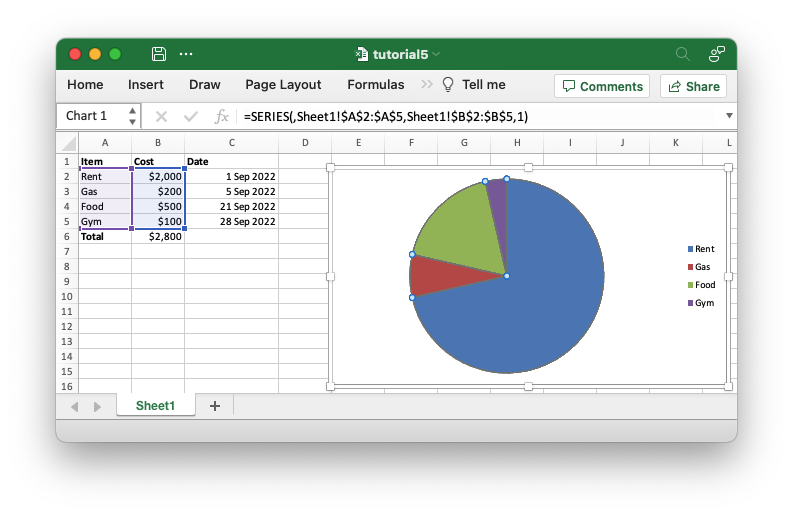
}This gives the same output to the previous version but it is now future proof for any changes to our input data: