Chart: Column: Excel Column chart example
Example of creating Excel Column charts.
Image of the output file:
Chart 1 in the following example is a default column chart:
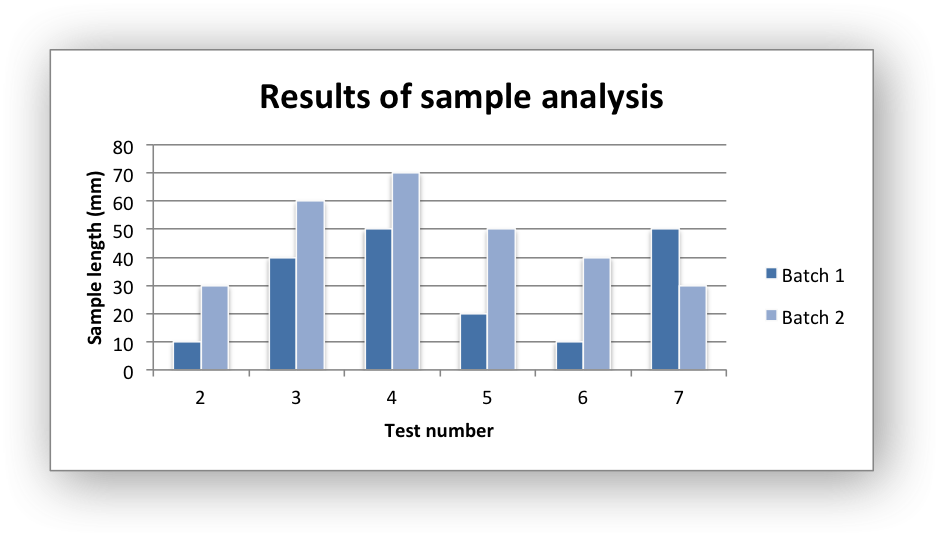
Chart 2 is a stacked column chart:
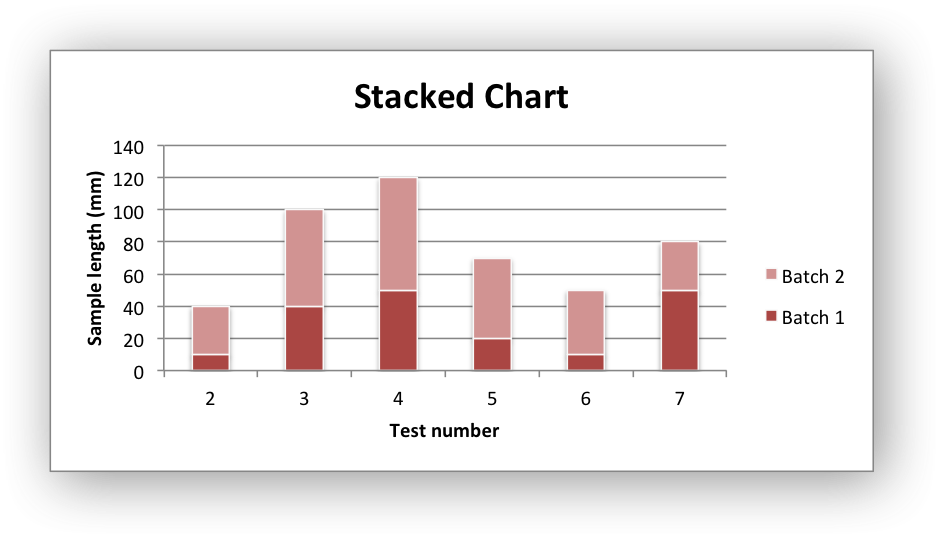
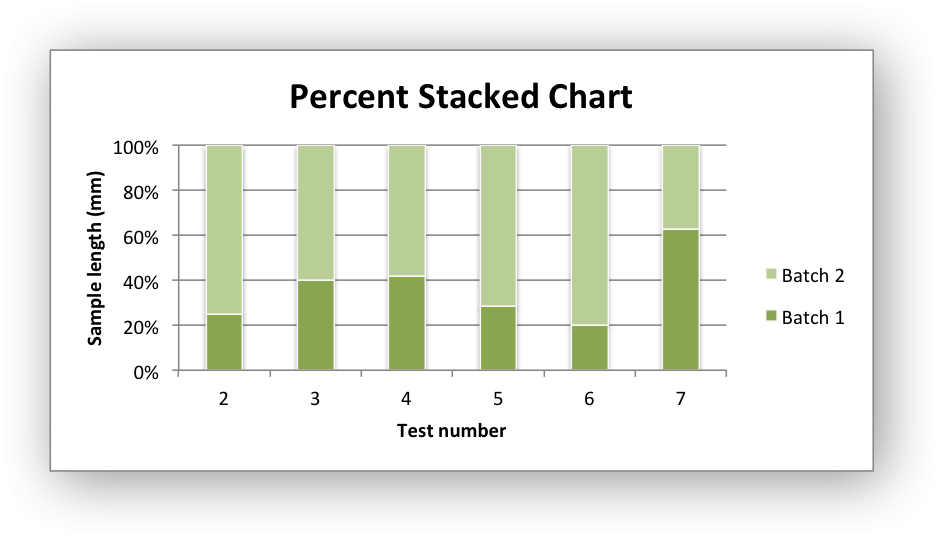
Chart 3 is a percentage stacked column chart:
Code to generate the output file:
// SPDX-License-Identifier: MIT OR Apache-2.0
//
// Copyright 2022-2026, John McNamara, jmcnamara@cpan.org

//! An example of creating column charts using the `rust_xlsxwriter` library.

use rust_xlsxwriter::{Chart, ChartType, Format, Workbook, XlsxError};

fn main() -> Result<(), XlsxError> {
    let mut workbook = Workbook::new();
    let worksheet = workbook.add_worksheet();
    let bold = Format::new().set_bold();

    // Add the worksheet data that the charts will refer to.
    worksheet.write_with_format(0, 0, "Number", &bold)?;
    worksheet.write_with_format(0, 1, "Batch 1", &bold)?;
    worksheet.write_with_format(0, 2, "Batch 2", &bold)?;

    let data = [
        [2, 3, 4, 5, 6, 7],
        [10, 40, 50, 20, 10, 50],
        [30, 60, 70, 50, 40, 30],
    ];
    for (col_num, col_data) in data.iter().enumerate() {
        for (row_num, row_data) in col_data.iter().enumerate() {
            worksheet.write(row_num as u32 + 1, col_num as u16, *row_data)?;
        }
    }

    // -----------------------------------------------------------------------
    // Create a new column chart.
    // -----------------------------------------------------------------------
    let mut chart = Chart::new(ChartType::Column);

    // Configure the first data series for the chart.
    chart
        .add_series()
        .set_categories("Sheet1!$A$2:$A$7")
        .set_values("Sheet1!$B$2:$B$7")
        .set_name("Sheet1!$B$1");

    // Add another data series to the chart using the alternative tuple syntax
    // to describe the range. This method is better when you need to create the
    // ranges programmatically to match the data range in the worksheet.
    let row_min = 1;
    let row_max = data[0].len() as u32;
    chart
        .add_series()
        .set_categories(("Sheet1", row_min, 0, row_max, 0))
        .set_values(("Sheet1", row_min, 2, row_max, 2))
        .set_name(("Sheet1", 0, 2));

    // Add a chart title and some axis labels.
    chart.title().set_name("Results of sample analysis");
    chart.x_axis().set_name("Test number");
    chart.y_axis().set_name("Sample length (mm)");

    // Set an Excel chart style.
    chart.set_style(11);

    // Add the chart to the worksheet.
    worksheet.insert_chart_with_offset(1, 3, &chart, 25, 10)?;

    // -----------------------------------------------------------------------
    // Create a stacked chart sub-type.
    // -----------------------------------------------------------------------
    let mut chart = Chart::new(ChartType::ColumnStacked);

    // Configure the first series.
    chart
        .add_series()
        .set_categories("Sheet1!$A$2:$A$7")
        .set_values("Sheet1!$B$2:$B$7")
        .set_name("Sheet1!$B$1");

    // Configure the second series.
    chart
        .add_series()
        .set_categories("Sheet1!$A$2:$A$7")
        .set_values("Sheet1!$C$2:$C$7")
        .set_name("Sheet1!$C$1");

    // Add a chart title and some axis labels.
    chart.title().set_name("Stacked Chart");
    chart.x_axis().set_name("Test number");
    chart.y_axis().set_name("Sample length (mm)");

    // Set an Excel chart style.
    chart.set_style(12);

    // Add the chart to the worksheet.
    worksheet.insert_chart_with_offset(17, 3, &chart, 25, 10)?;

    // -----------------------------------------------------------------------
    // Create a percentage stacked chart sub-type.
    // -----------------------------------------------------------------------
    let mut chart = Chart::new(ChartType::ColumnPercentStacked);

    // Configure the first series.
    chart
        .add_series()
        .set_categories("Sheet1!$A$2:$A$7")
        .set_values("Sheet1!$B$2:$B$7")
        .set_name("Sheet1!$B$1");

    // Configure the second series.
    chart
        .add_series()
        .set_categories("Sheet1!$A$2:$A$7")
        .set_values("Sheet1!$C$2:$C$7")
        .set_name("Sheet1!$C$1");

    // Add a chart title and some axis labels.
    chart.title().set_name("Percent Stacked Chart");
    chart.x_axis().set_name("Test number");
    chart.y_axis().set_name("Sample length (mm)");

    // Set an Excel chart style.
    chart.set_style(13);

    // Add the chart to the worksheet.
    worksheet.insert_chart_with_offset(33, 3, &chart, 25, 10)?;

    workbook.save("chart_column.xlsx")?;

    Ok(())
}