Adding a chart
To extend our example a little further let's add a Pie chart to show the relative sizes of the outgoing expenses to get a spreadsheet that will look like this:
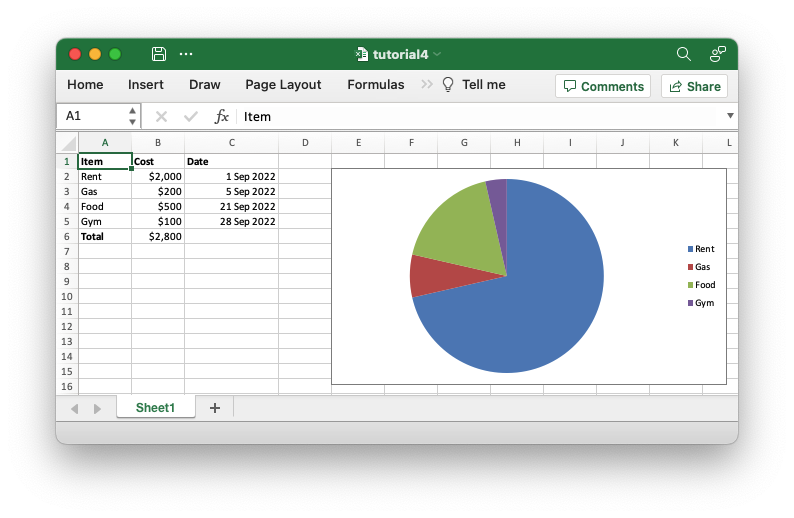
We use the Chart struct to represent the chart.
The Chart struct has a lot of configuration options and sub-structs to
replicate Excel's chart features but as an initial demonstration we will just
add the data series to which the chart refers. Here is the updated code with the
chart addition at the end.
// SPDX-License-Identifier: MIT OR Apache-2.0
//
// Copyright 2022-2026, John McNamara, jmcnamara@cpan.org

//! A simple program to write some data to an Excel spreadsheet using
//! `rust_xlsxwriter`. Part 4 of a tutorial.

use rust_xlsxwriter::{Chart, ExcelDateTime, Format, Formula, Workbook, XlsxError};

fn main() -> Result<(), XlsxError> {
    // Some sample data we want to write to a spreadsheet.
    let expenses = vec![
        ("Rent", 2000, "2022-09-01"),
        ("Gas", 200, "2022-09-05"),
        ("Food", 500, "2022-09-21"),
        ("Gym", 100, "2022-09-28"),
    ];

    // Create a new Excel file object.
    let mut workbook = Workbook::new();

    // Add a bold format to use to highlight cells.
    let bold = Format::new().set_bold();

    // Add a number format for cells with money values.
    let money_format = Format::new().set_num_format("$#,##0");

    // Add a number format for cells with dates.
    let date_format = Format::new().set_num_format("d mmm yyyy");

    // Add a worksheet to the workbook.
    let worksheet = workbook.add_worksheet();

    // Write some column headers.
    worksheet.write_with_format(0, 0, "Item", &bold)?;
    worksheet.write_with_format(0, 1, "Cost", &bold)?;
    worksheet.write_with_format(0, 2, "Date", &bold)?;

    // Adjust the date column width for clarity.
    worksheet.set_column_width(2, 15)?;

    // Iterate over the data and write it out row by row.
    let mut last_row = 1;
    for expense in &expenses {
        worksheet.write(last_row, 0, expense.0)?;
        worksheet.write_with_format(last_row, 1, expense.1, &money_format)?;

        let date = ExcelDateTime::parse_from_str(expense.2)?;
        worksheet.write_with_format(last_row, 2, &date, &date_format)?;

        last_row += 1;
    }

    // Write a total using a formula.
    worksheet.write_with_format(last_row, 0, "Total", &bold)?;
    worksheet.write_with_format(last_row, 1, Formula::new("=SUM(B2:B5)"), &money_format)?;

    // Add a chart to display the expenses.
    let mut chart = Chart::new_pie();

    // Configure the data series for the chart.
    chart
        .add_series()
        .set_categories("Sheet1!$A$2:$A$5")
        .set_values("Sheet1!$B$2:$B$5");

    // Add the chart to the worksheet.
    worksheet.insert_chart(1, 4, &chart)?;

    // Save the file to disk.
    workbook.save("tutorial4.xlsx")?;

    Ok(())
}
See the documentation for Chart for more information.