Chart: Doughnut: Excel Doughnut chart example
Example of creating Excel Doughnut charts.
Image of the output file:
Chart 1 in the following example is a default doughnut chart:
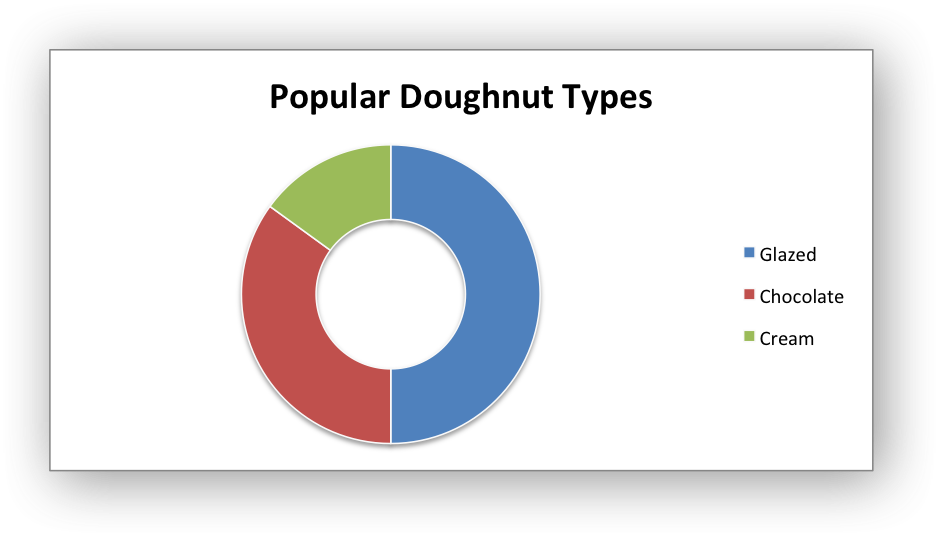
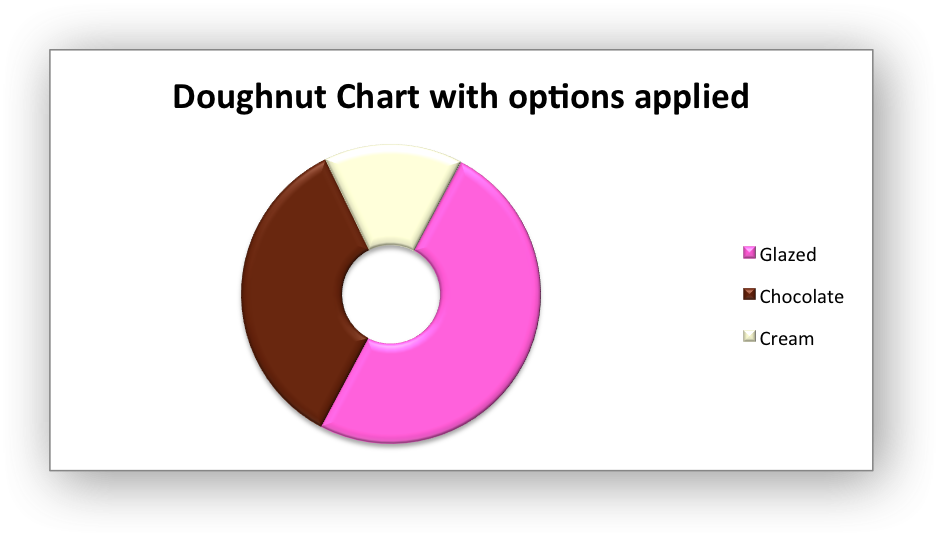
Chart 4 shows how to set segment colors and other options.
Code to generate the output file:
// SPDX-License-Identifier: MIT OR Apache-2.0
//
// Copyright 2022-2026, John McNamara, jmcnamara@cpan.org

//! An example of creating doughnut charts using the `rust_xlsxwriter` library.

use rust_xlsxwriter::{Chart, Format, Workbook, XlsxError};

fn main() -> Result<(), XlsxError> {
    let mut workbook = Workbook::new();
    let worksheet = workbook.add_worksheet();
    let bold = Format::new().set_bold();

    // Add the worksheet data that the charts will refer to.
    worksheet.write_with_format(0, 0, "Category", &bold)?;
    worksheet.write_with_format(0, 1, "Values", &bold)?;

    worksheet.write(1, 0, "Glazed")?;
    worksheet.write(2, 0, "Chocolate")?;
    worksheet.write(3, 0, "Cream")?;

    worksheet.write(1, 1, 50)?;
    worksheet.write(2, 1, 35)?;
    worksheet.write(3, 1, 15)?;

    // -----------------------------------------------------------------------
    // Create a new doughnut chart.
    // -----------------------------------------------------------------------
    let mut chart = Chart::new_doughnut();

    // Configure the data series for the chart.
    chart
        .add_series()
        .set_categories("Sheet1!$A$2:$A$4")
        .set_values("Sheet1!$B$2:$B$4")
        .set_name("Doughnut sales data");

    // Add a chart title.
    chart.title().set_name("Popular Doughnut Types");

    // Set an Excel chart style.
    chart.set_style(10);

    // Add the chart to the worksheet.
    worksheet.insert_chart_with_offset(1, 2, &chart, 25, 10)?;

    // -----------------------------------------------------------------------
    // Create a Doughnut chart with user defined segment colors.
    // -----------------------------------------------------------------------
    let mut chart = Chart::new_doughnut();

    // Configure the data series for the chart.
    chart
        .add_series()
        .set_categories("Sheet1!$A$2:$A$4")
        .set_values("Sheet1!$B$2:$B$4")
        .set_name("Doughnut sales data")
        .set_point_colors(&["#FA58D0", "#61210B", "#F5F6CE"]);

    // Add a chart title.
    chart
        .title()
        .set_name("Doughnut Chart with user defined colors");

    // Add the chart to the worksheet.
    worksheet.insert_chart_with_offset(17, 2, &chart, 25, 10)?;

    // -----------------------------------------------------------------------
    // Create a Doughnut chart with rotation of the segments.
    // -----------------------------------------------------------------------
    let mut chart = Chart::new_doughnut();

    // Configure the data series for the chart.
    chart
        .add_series()
        .set_categories("Sheet1!$A$2:$A$4")
        .set_values("Sheet1!$B$2:$B$4")
        .set_name("Doughnut sales data");

    // Change the angle/rotation of the first segment.
    chart.set_rotation(90);

    // Add a chart title.
    chart
        .title()
        .set_name("Doughnut Chart with segment rotation");

    // Add the chart to the worksheet.
    worksheet.insert_chart_with_offset(33, 2, &chart, 25, 10)?;

    // -----------------------------------------------------------------------
    // Create a Doughnut chart with user defined hole size and other options.
    // -----------------------------------------------------------------------
    let mut chart = Chart::new_doughnut();

    // Configure the data series for the chart.
    chart
        .add_series()
        .set_categories("Sheet1!$A$2:$A$4")
        .set_values("Sheet1!$B$2:$B$4")
        .set_name("Doughnut sales data")
        .set_point_colors(&["#FA58D0", "#61210B", "#F5F6CE"]);

    // Add a chart title.
    chart
        .title()
        .set_name("Doughnut Chart with options applied");

    // Change the angle/rotation of the first segment.
    chart.set_rotation(28);

    // Change the hole size.
    chart.set_hole_size(33);

    // Set a 3D style.
    chart.set_style(26);

    // Add the chart to the worksheet.
    worksheet.insert_chart_with_offset(49, 2, &chart, 25, 10)?;

    workbook.save("chart_doughnut.xlsx")?;

    Ok(())
}