Pivot Tables: Adding pivot tables
Pivot tables in Excel are a way of summarizing, grouping and analyzing a range of source data. The unique values of the source data fields can be arranged as row and column labels, and the numeric fields are summarized, for example as a sum or an average, for each label. Pivot tables can also have filter fields, different layouts and formatting styles.
The image below shows a pivot table in Excel with the "Pivot Table Fields" list used to arrange the fields.
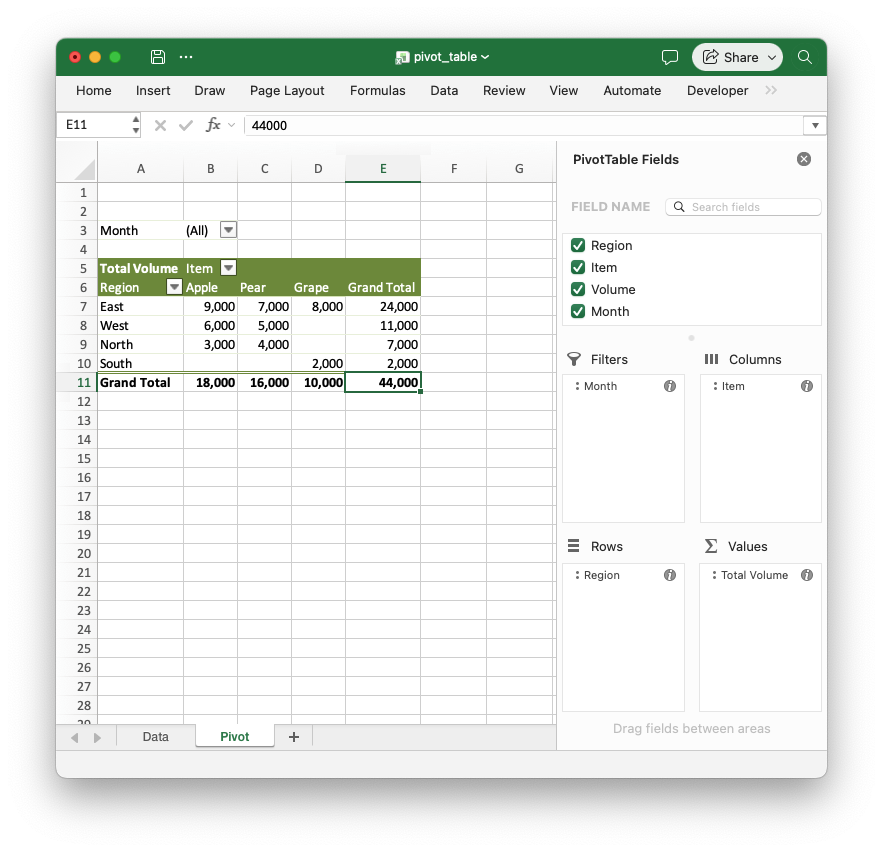
A pivot table is added to a worksheet via the Worksheet::add_pivot_table()
method. The source data range and fields of a pivot table are configured via a
PivotTable struct, but the source data is added using standard
Worksheet::write() methods.
Some examples:
Example 1. Pivot table with no fields.
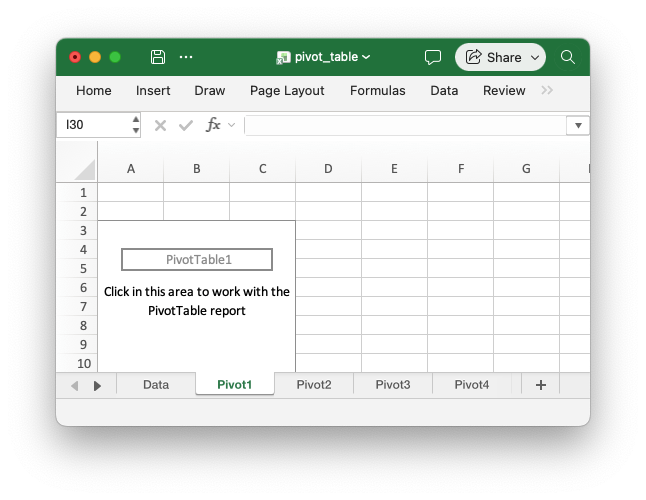
Code to generate the above example:
// SPDX-License-Identifier: MIT OR Apache-2.0
//
// Copyright 2022-2026, John McNamara, jmcnamara@cpan.org

//! An example of how to create pivot tables with the `rust_xlsxwriter` library.
//!
//! A pivot table is a way of grouping and summarizing the data in a worksheet
//! range.
//!

use rust_xlsxwriter::{
    Format, PivotTable, PivotTableFunction, PivotTableLayout, PivotTableStyle,
    PivotTableValueField, Workbook, Worksheet, XlsxError,
};

fn main() -> Result<(), XlsxError> {
    // Create a new Excel file object.
    let mut workbook = Workbook::new();

    // Add a worksheet with some sample data for the pivot tables.
    let worksheet = workbook.add_worksheet().set_name("Data")?;
    populate_pivot_data(worksheet)?;

    // -----------------------------------------------------------------------
    // 1. Add an empty pivot table.
    // -----------------------------------------------------------------------

    // Create a pivot table based on the worksheet data.
    let pivot_table = PivotTable::new().set_data_source("Data!A1:D51");

    // Add the pivot table to a new worksheet.
    let worksheet = workbook.add_worksheet().set_name("Pivot1")?;
    worksheet.add_pivot_table(2, 0, &pivot_table)?;

    // -----------------------------------------------------------------------
    // 2. Add a pivot table with a Row field and a Value field.
    // -----------------------------------------------------------------------

    // Create a pivot table based on the worksheet data and summarize the
    // "Volume" data by "Region". Note that the data source can also be
    // specified as a tuple.
    let pivot_table = PivotTable::new()
        .set_data_source(("Data", 0, 0, 50, 3))
        .add_row_field("Region")
        .add_value_field(&PivotTableValueField::new("Volume"));

    // Add the pivot table to a new worksheet.
    let worksheet = workbook.add_worksheet().set_name("Pivot2")?;
    worksheet.add_pivot_table(2, 0, &pivot_table)?;

    // -----------------------------------------------------------------------
    // 3. Add a pivot table with a Row field, a Column field and a Value field.
    // -----------------------------------------------------------------------

    // Create a pivot table based on the worksheet data and summarize the
    // "Volume" data by "Region" and "Item".
    let pivot_table = PivotTable::new()
        .set_data_source("Data!A1:D51")
        .add_row_field("Region")
        .add_column_field("Item")
        .add_value_field(&PivotTableValueField::new("Volume"));

    // Add the pivot table to a new worksheet.
    let worksheet = workbook.add_worksheet().set_name("Pivot3")?;
    worksheet.add_pivot_table(2, 0, &pivot_table)?;

    // -----------------------------------------------------------------------
    // 4. Add a pivot table with a Filter field.
    // -----------------------------------------------------------------------

    // Create a pivot table based on the worksheet data and summarize the
    // "Volume" data by "Region", with a filter on "Month".
    let pivot_table = PivotTable::new()
        .set_data_source("Data!A1:D51")
        .add_row_field("Region")
        .add_value_field(&PivotTableValueField::new("Volume"))
        .add_filter_field("Month");

    // Add the pivot table to a new worksheet. The filter is displayed in the
    // first row and the pivot table body starts in the third row.
    let worksheet = workbook.add_worksheet().set_name("Pivot4")?;
    worksheet.add_pivot_table(0, 0, &pivot_table)?;

    // -----------------------------------------------------------------------
    // 5. Add a pivot table with two Row fields.
    // -----------------------------------------------------------------------

    // Create a pivot table based on the worksheet data and summarize the
    // "Volume" data by "Region" and then by "Item" within each region.
    let pivot_table = PivotTable::new()
        .set_data_source("Data!A1:D51")
        .add_row_field("Region")
        .add_row_field("Item")
        .add_value_field(&PivotTableValueField::new("Volume"));

    // Add the pivot table to a new worksheet.
    let worksheet = workbook.add_worksheet().set_name("Pivot5")?;
    worksheet.add_pivot_table(2, 0, &pivot_table)?;

    // -----------------------------------------------------------------------
    // 6. Add a pivot table with several Value fields.
    // -----------------------------------------------------------------------

    // Create a pivot table based on the worksheet data and summarize the
    // "Volume" data by "Region" using different functions.
    let pivot_table = PivotTable::new()
        .set_data_source("Data!A1:D51")
        .add_row_field("Region")
        .add_value_field(&PivotTableValueField::new("Volume"))
        .add_value_field(
            &PivotTableValueField::new("Volume").set_function(PivotTableFunction::Count),
        )
        .add_value_field(
            &PivotTableValueField::new("Volume").set_function(PivotTableFunction::Average),
        );

    // Add the pivot table to a new worksheet.
    let worksheet = workbook.add_worksheet().set_name("Pivot6")?;
    worksheet.add_pivot_table(2, 0, &pivot_table)?;

    // -----------------------------------------------------------------------
    // 7. Add a pivot table with a custom name and number format.
    // -----------------------------------------------------------------------

    // Create a pivot table based on the worksheet data and summarize the
    // "Volume" data by "Region", with a custom name and number format.
    let pivot_table = PivotTable::new()
        .set_data_source("Data!A1:D51")
        .add_row_field("Region")
        .add_value_field(
            &PivotTableValueField::new("Volume")
                .set_custom_name("Total Volume")
                .set_num_format("#,##0"),
        );

    // Add the pivot table to a new worksheet.
    let worksheet = workbook.add_worksheet().set_name("Pivot7")?;
    worksheet.add_pivot_table(2, 0, &pivot_table)?;

    // -----------------------------------------------------------------------
    // 8. Add a pivot table with a different style and no grand totals.
    // -----------------------------------------------------------------------

    // Create a pivot table based on the worksheet data and summarize the
    // "Volume" data by "Region" and "Item", without grand totals.
    let pivot_table = PivotTable::new()
        .set_data_source("Data!A1:D51")
        .add_row_field("Region")
        .add_column_field("Item")
        .add_value_field(&PivotTableValueField::new("Volume"))
        .set_style(PivotTableStyle::Medium9)
        .set_row_grand_totals(false)
        .set_column_grand_totals(false);

    // Add the pivot table to a new worksheet.
    let worksheet = workbook.add_worksheet().set_name("Pivot8")?;
    worksheet.add_pivot_table(2, 0, &pivot_table)?;

    // -----------------------------------------------------------------------
    // 9. Add a pivot table with a tabular layout.
    // -----------------------------------------------------------------------

    // Create a pivot table based on the worksheet data and summarize the
    // "Volume" data by "Region" and "Item", with each row field in its own
    // column.
    let pivot_table = PivotTable::new()
        .set_data_source("Data!A1:D51")
        .add_row_field("Region")
        .add_row_field("Item")
        .add_value_field(&PivotTableValueField::new("Volume"))
        .set_layout(PivotTableLayout::Tabular);

    // Add the pivot table to a new worksheet.
    let worksheet = workbook.add_worksheet().set_name("Pivot9")?;
    worksheet.add_pivot_table(2, 0, &pivot_table)?;

    // -----------------------------------------------------------------------
    // 10. Add two pivot tables to the same worksheet.
    // -----------------------------------------------------------------------

    // Create two pivot tables based on the worksheet data and summarize the
    // "Volume" data by "Region" in one and by "Item" in the other.
    let pivot_table1 = PivotTable::new()
        .set_data_source("Data!A1:D51")
        .add_row_field("Region")
        .add_value_field(&PivotTableValueField::new("Volume"));

    let pivot_table2 = PivotTable::new()
        .set_data_source("Data!A1:D51")
        .add_row_field("Item")
        .add_value_field(&PivotTableValueField::new("Volume"));

    // Add the pivot tables side by side on a new worksheet.
    let worksheet = workbook.add_worksheet().set_name("Pivot10")?;
    worksheet.add_pivot_table(2, 0, &pivot_table1)?;
    worksheet.add_pivot_table(2, 5, &pivot_table2)?;

    // -----------------------------------------------------------------------
    // 11. Add a pivot table to the same worksheet as the data.
    // -----------------------------------------------------------------------

    // Add a new worksheet with a copy of the sample data.
    let worksheet = workbook.add_worksheet().set_name("Pivot11")?;
    populate_pivot_data(worksheet)?;

    // Create a pivot table based on the data in the same worksheet and
    // summarize the "Volume" data by "Region".
    let pivot_table = PivotTable::new()
        .set_data_source("Pivot11!A1:D51")
        .add_row_field("Region")
        .add_value_field(&PivotTableValueField::new("Volume"));

    // Add the pivot table to the right of the data.
    worksheet.add_pivot_table(2, 6, &pivot_table)?;

    // Save the file to disk.
    workbook.save("pivot_table.xlsx")?;

    Ok(())
}

// Generate worksheet data for the pivot tables.
pub fn populate_pivot_data(worksheet: &mut Worksheet) -> Result<(), XlsxError> {
    // The sample data to add to the worksheet.
    let data = [
        ("East", "Apple", 9000, "July"),
        ("East", "Apple", 5000, "April"),
        ("South", "Orange", 9000, "September"),
        ("North", "Apple", 2000, "November"),
        ("West", "Apple", 9000, "November"),
        ("South", "Pear", 7000, "October"),
        ("North", "Pear", 9000, "August"),
        ("West", "Orange", 1000, "December"),
        ("West", "Grape", 1000, "November"),
        ("South", "Pear", 10000, "April"),
        ("West", "Grape", 6000, "January"),
        ("South", "Orange", 3000, "May"),
        ("North", "Apple", 3000, "December"),
        ("South", "Apple", 7000, "February"),
        ("West", "Grape", 1000, "December"),
        ("East", "Grape", 8000, "February"),
        ("South", "Grape", 10000, "June"),
        ("West", "Pear", 7000, "December"),
        ("South", "Apple", 2000, "October"),
        ("East", "Grape", 7000, "December"),
        ("North", "Grape", 6000, "July"),
        ("East", "Pear", 8000, "February"),
        ("North", "Apple", 7000, "August"),
        ("North", "Orange", 7000, "July"),
        ("North", "Apple", 6000, "June"),
        ("South", "Grape", 8000, "September"),
        ("West", "Apple", 3000, "October"),
        ("South", "Orange", 10000, "November"),
        ("West", "Grape", 4000, "December"),
        ("North", "Orange", 5000, "August"),
        ("East", "Orange", 1000, "November"),
        ("East", "Orange", 4000, "October"),
        ("North", "Grape", 5000, "August"),
        ("East", "Apple", 1000, "July"),
        ("South", "Apple", 10000, "March"),
        ("East", "Grape", 7000, "October"),
        ("West", "Grape", 1000, "September"),
        ("East", "Grape", 10000, "October"),
        ("South", "Orange", 8000, "March"),
        ("North", "Apple", 4000, "July"),
        ("South", "Orange", 5000, "July"),
        ("West", "Apple", 4000, "June"),
        ("East", "Apple", 5000, "April"),
        ("North", "Pear", 3000, "August"),
        ("East", "Grape", 9000, "November"),
        ("North", "Orange", 8000, "October"),
        ("East", "Apple", 10000, "June"),
        ("South", "Pear", 1000, "December"),
        ("North", "Grape", 10000, "July"),
        ("East", "Grape", 6000, "February"),
    ];

    // Widen the columns for clarity.
    worksheet.set_column_width(0, 12)?;
    worksheet.set_column_width(1, 12)?;
    worksheet.set_column_width(2, 12)?;
    worksheet.set_column_width(3, 12)?;

    // Write the header titles.
    let header_format = Format::new().set_bold();
    worksheet.write_string_with_format(0, 0, "Region", &header_format)?;
    worksheet.write_string_with_format(0, 1, "Item", &header_format)?;
    worksheet.write_string_with_format(0, 2, "Volume", &header_format)?;
    worksheet.write_string_with_format(0, 3, "Month", &header_format)?;

    // Write the other worksheet data.
    for (row, data) in data.iter().enumerate() {
        let row = 1 + row as u32;
        worksheet.write_string(row, 0, data.0)?;
        worksheet.write_string(row, 1, data.1)?;
        worksheet.write_number(row, 2, data.2)?;
        worksheet.write_string(row, 3, data.3)?;
    }

    Ok(())
}
Example 2. Pivot table with a row field and a value field. Note that the data source can also be specified as a tuple.
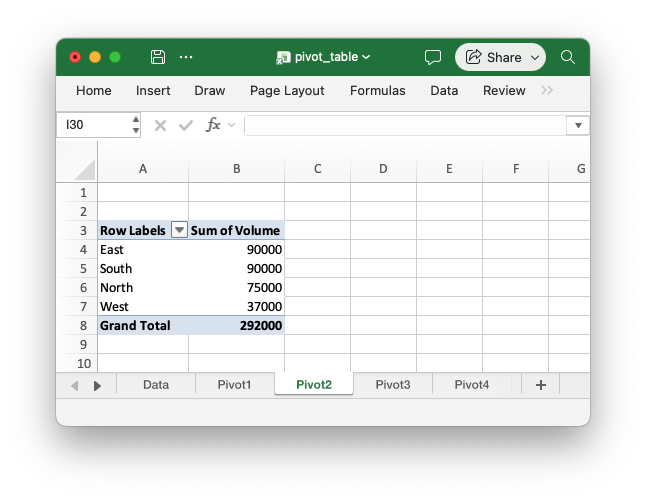
Code to generate the above example:
// SPDX-License-Identifier: MIT OR Apache-2.0
//
// Copyright 2022-2026, John McNamara, jmcnamara@cpan.org

//! An example of how to create pivot tables with the `rust_xlsxwriter` library.
//!
//! A pivot table is a way of grouping and summarizing the data in a worksheet
//! range.
//!

use rust_xlsxwriter::{
    Format, PivotTable, PivotTableFunction, PivotTableLayout, PivotTableStyle,
    PivotTableValueField, Workbook, Worksheet, XlsxError,
};

fn main() -> Result<(), XlsxError> {
    // Create a new Excel file object.
    let mut workbook = Workbook::new();

    // Add a worksheet with some sample data for the pivot tables.
    let worksheet = workbook.add_worksheet().set_name("Data")?;
    populate_pivot_data(worksheet)?;

    // -----------------------------------------------------------------------
    // 1. Add an empty pivot table.
    // -----------------------------------------------------------------------

    // Create a pivot table based on the worksheet data.
    let pivot_table = PivotTable::new().set_data_source("Data!A1:D51");

    // Add the pivot table to a new worksheet.
    let worksheet = workbook.add_worksheet().set_name("Pivot1")?;
    worksheet.add_pivot_table(2, 0, &pivot_table)?;

    // -----------------------------------------------------------------------
    // 2. Add a pivot table with a Row field and a Value field.
    // -----------------------------------------------------------------------

    // Create a pivot table based on the worksheet data and summarize the
    // "Volume" data by "Region". Note that the data source can also be
    // specified as a tuple.
    let pivot_table = PivotTable::new()
        .set_data_source(("Data", 0, 0, 50, 3))
        .add_row_field("Region")
        .add_value_field(&PivotTableValueField::new("Volume"));

    // Add the pivot table to a new worksheet.
    let worksheet = workbook.add_worksheet().set_name("Pivot2")?;
    worksheet.add_pivot_table(2, 0, &pivot_table)?;

    // -----------------------------------------------------------------------
    // 3. Add a pivot table with a Row field, a Column field and a Value field.
    // -----------------------------------------------------------------------

    // Create a pivot table based on the worksheet data and summarize the
    // "Volume" data by "Region" and "Item".
    let pivot_table = PivotTable::new()
        .set_data_source("Data!A1:D51")
        .add_row_field("Region")
        .add_column_field("Item")
        .add_value_field(&PivotTableValueField::new("Volume"));

    // Add the pivot table to a new worksheet.
    let worksheet = workbook.add_worksheet().set_name("Pivot3")?;
    worksheet.add_pivot_table(2, 0, &pivot_table)?;

    // -----------------------------------------------------------------------
    // 4. Add a pivot table with a Filter field.
    // -----------------------------------------------------------------------

    // Create a pivot table based on the worksheet data and summarize the
    // "Volume" data by "Region", with a filter on "Month".
    let pivot_table = PivotTable::new()
        .set_data_source("Data!A1:D51")
        .add_row_field("Region")
        .add_value_field(&PivotTableValueField::new("Volume"))
        .add_filter_field("Month");

    // Add the pivot table to a new worksheet. The filter is displayed in the
    // first row and the pivot table body starts in the third row.
    let worksheet = workbook.add_worksheet().set_name("Pivot4")?;
    worksheet.add_pivot_table(0, 0, &pivot_table)?;

    // -----------------------------------------------------------------------
    // 5. Add a pivot table with two Row fields.
    // -----------------------------------------------------------------------

    // Create a pivot table based on the worksheet data and summarize the
    // "Volume" data by "Region" and then by "Item" within each region.
    let pivot_table = PivotTable::new()
        .set_data_source("Data!A1:D51")
        .add_row_field("Region")
        .add_row_field("Item")
        .add_value_field(&PivotTableValueField::new("Volume"));

    // Add the pivot table to a new worksheet.
    let worksheet = workbook.add_worksheet().set_name("Pivot5")?;
    worksheet.add_pivot_table(2, 0, &pivot_table)?;

    // -----------------------------------------------------------------------
    // 6. Add a pivot table with several Value fields.
    // -----------------------------------------------------------------------

    // Create a pivot table based on the worksheet data and summarize the
    // "Volume" data by "Region" using different functions.
    let pivot_table = PivotTable::new()
        .set_data_source("Data!A1:D51")
        .add_row_field("Region")
        .add_value_field(&PivotTableValueField::new("Volume"))
        .add_value_field(
            &PivotTableValueField::new("Volume").set_function(PivotTableFunction::Count),
        )
        .add_value_field(
            &PivotTableValueField::new("Volume").set_function(PivotTableFunction::Average),
        );

    // Add the pivot table to a new worksheet.
    let worksheet = workbook.add_worksheet().set_name("Pivot6")?;
    worksheet.add_pivot_table(2, 0, &pivot_table)?;

    // -----------------------------------------------------------------------
    // 7. Add a pivot table with a custom name and number format.
    // -----------------------------------------------------------------------

    // Create a pivot table based on the worksheet data and summarize the
    // "Volume" data by "Region", with a custom name and number format.
    let pivot_table = PivotTable::new()
        .set_data_source("Data!A1:D51")
        .add_row_field("Region")
        .add_value_field(
            &PivotTableValueField::new("Volume")
                .set_custom_name("Total Volume")
                .set_num_format("#,##0"),
        );

    // Add the pivot table to a new worksheet.
    let worksheet = workbook.add_worksheet().set_name("Pivot7")?;
    worksheet.add_pivot_table(2, 0, &pivot_table)?;

    // -----------------------------------------------------------------------
    // 8. Add a pivot table with a different style and no grand totals.
    // -----------------------------------------------------------------------

    // Create a pivot table based on the worksheet data and summarize the
    // "Volume" data by "Region" and "Item", without grand totals.
    let pivot_table = PivotTable::new()
        .set_data_source("Data!A1:D51")
        .add_row_field("Region")
        .add_column_field("Item")
        .add_value_field(&PivotTableValueField::new("Volume"))
        .set_style(PivotTableStyle::Medium9)
        .set_row_grand_totals(false)
        .set_column_grand_totals(false);

    // Add the pivot table to a new worksheet.
    let worksheet = workbook.add_worksheet().set_name("Pivot8")?;
    worksheet.add_pivot_table(2, 0, &pivot_table)?;

    // -----------------------------------------------------------------------
    // 9. Add a pivot table with a tabular layout.
    // -----------------------------------------------------------------------

    // Create a pivot table based on the worksheet data and summarize the
    // "Volume" data by "Region" and "Item", with each row field in its own
    // column.
    let pivot_table = PivotTable::new()
        .set_data_source("Data!A1:D51")
        .add_row_field("Region")
        .add_row_field("Item")
        .add_value_field(&PivotTableValueField::new("Volume"))
        .set_layout(PivotTableLayout::Tabular);

    // Add the pivot table to a new worksheet.
    let worksheet = workbook.add_worksheet().set_name("Pivot9")?;
    worksheet.add_pivot_table(2, 0, &pivot_table)?;

    // -----------------------------------------------------------------------
    // 10. Add two pivot tables to the same worksheet.
    // -----------------------------------------------------------------------

    // Create two pivot tables based on the worksheet data and summarize the
    // "Volume" data by "Region" in one and by "Item" in the other.
    let pivot_table1 = PivotTable::new()
        .set_data_source("Data!A1:D51")
        .add_row_field("Region")
        .add_value_field(&PivotTableValueField::new("Volume"));

    let pivot_table2 = PivotTable::new()
        .set_data_source("Data!A1:D51")
        .add_row_field("Item")
        .add_value_field(&PivotTableValueField::new("Volume"));

    // Add the pivot tables side by side on a new worksheet.
    let worksheet = workbook.add_worksheet().set_name("Pivot10")?;
    worksheet.add_pivot_table(2, 0, &pivot_table1)?;
    worksheet.add_pivot_table(2, 5, &pivot_table2)?;

    // -----------------------------------------------------------------------
    // 11. Add a pivot table to the same worksheet as the data.
    // -----------------------------------------------------------------------

    // Add a new worksheet with a copy of the sample data.
    let worksheet = workbook.add_worksheet().set_name("Pivot11")?;
    populate_pivot_data(worksheet)?;

    // Create a pivot table based on the data in the same worksheet and
    // summarize the "Volume" data by "Region".
    let pivot_table = PivotTable::new()
        .set_data_source("Pivot11!A1:D51")
        .add_row_field("Region")
        .add_value_field(&PivotTableValueField::new("Volume"));

    // Add the pivot table to the right of the data.
    worksheet.add_pivot_table(2, 6, &pivot_table)?;

    // Save the file to disk.
    workbook.save("pivot_table.xlsx")?;

    Ok(())
}

// Generate worksheet data for the pivot tables.
pub fn populate_pivot_data(worksheet: &mut Worksheet) -> Result<(), XlsxError> {
    // The sample data to add to the worksheet.
    let data = [
        ("East", "Apple", 9000, "July"),
        ("East", "Apple", 5000, "April"),
        ("South", "Orange", 9000, "September"),
        ("North", "Apple", 2000, "November"),
        ("West", "Apple", 9000, "November"),
        ("South", "Pear", 7000, "October"),
        ("North", "Pear", 9000, "August"),
        ("West", "Orange", 1000, "December"),
        ("West", "Grape", 1000, "November"),
        ("South", "Pear", 10000, "April"),
        ("West", "Grape", 6000, "January"),
        ("South", "Orange", 3000, "May"),
        ("North", "Apple", 3000, "December"),
        ("South", "Apple", 7000, "February"),
        ("West", "Grape", 1000, "December"),
        ("East", "Grape", 8000, "February"),
        ("South", "Grape", 10000, "June"),
        ("West", "Pear", 7000, "December"),
        ("South", "Apple", 2000, "October"),
        ("East", "Grape", 7000, "December"),
        ("North", "Grape", 6000, "July"),
        ("East", "Pear", 8000, "February"),
        ("North", "Apple", 7000, "August"),
        ("North", "Orange", 7000, "July"),
        ("North", "Apple", 6000, "June"),
        ("South", "Grape", 8000, "September"),
        ("West", "Apple", 3000, "October"),
        ("South", "Orange", 10000, "November"),
        ("West", "Grape", 4000, "December"),
        ("North", "Orange", 5000, "August"),
        ("East", "Orange", 1000, "November"),
        ("East", "Orange", 4000, "October"),
        ("North", "Grape", 5000, "August"),
        ("East", "Apple", 1000, "July"),
        ("South", "Apple", 10000, "March"),
        ("East", "Grape", 7000, "October"),
        ("West", "Grape", 1000, "September"),
        ("East", "Grape", 10000, "October"),
        ("South", "Orange", 8000, "March"),
        ("North", "Apple", 4000, "July"),
        ("South", "Orange", 5000, "July"),
        ("West", "Apple", 4000, "June"),
        ("East", "Apple", 5000, "April"),
        ("North", "Pear", 3000, "August"),
        ("East", "Grape", 9000, "November"),
        ("North", "Orange", 8000, "October"),
        ("East", "Apple", 10000, "June"),
        ("South", "Pear", 1000, "December"),
        ("North", "Grape", 10000, "July"),
        ("East", "Grape", 6000, "February"),
    ];

    // Widen the columns for clarity.
    worksheet.set_column_width(0, 12)?;
    worksheet.set_column_width(1, 12)?;
    worksheet.set_column_width(2, 12)?;
    worksheet.set_column_width(3, 12)?;

    // Write the header titles.
    let header_format = Format::new().set_bold();
    worksheet.write_string_with_format(0, 0, "Region", &header_format)?;
    worksheet.write_string_with_format(0, 1, "Item", &header_format)?;
    worksheet.write_string_with_format(0, 2, "Volume", &header_format)?;
    worksheet.write_string_with_format(0, 3, "Month", &header_format)?;

    // Write the other worksheet data.
    for (row, data) in data.iter().enumerate() {
        let row = 1 + row as u32;
        worksheet.write_string(row, 0, data.0)?;
        worksheet.write_string(row, 1, data.1)?;
        worksheet.write_number(row, 2, data.2)?;
        worksheet.write_string(row, 3, data.3)?;
    }

    Ok(())
}
Example 3. Pivot table with a row field, a column field and a value field.
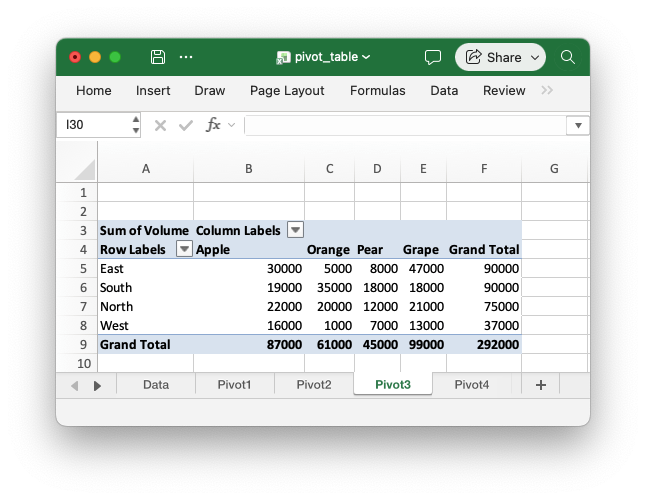
Code to generate the above example:
// SPDX-License-Identifier: MIT OR Apache-2.0
//
// Copyright 2022-2026, John McNamara, jmcnamara@cpan.org

//! An example of how to create pivot tables with the `rust_xlsxwriter` library.
//!
//! A pivot table is a way of grouping and summarizing the data in a worksheet
//! range.
//!

use rust_xlsxwriter::{
    Format, PivotTable, PivotTableFunction, PivotTableLayout, PivotTableStyle,
    PivotTableValueField, Workbook, Worksheet, XlsxError,
};

fn main() -> Result<(), XlsxError> {
    // Create a new Excel file object.
    let mut workbook = Workbook::new();

    // Add a worksheet with some sample data for the pivot tables.
    let worksheet = workbook.add_worksheet().set_name("Data")?;
    populate_pivot_data(worksheet)?;

    // -----------------------------------------------------------------------
    // 1. Add an empty pivot table.
    // -----------------------------------------------------------------------

    // Create a pivot table based on the worksheet data.
    let pivot_table = PivotTable::new().set_data_source("Data!A1:D51");

    // Add the pivot table to a new worksheet.
    let worksheet = workbook.add_worksheet().set_name("Pivot1")?;
    worksheet.add_pivot_table(2, 0, &pivot_table)?;

    // -----------------------------------------------------------------------
    // 2. Add a pivot table with a Row field and a Value field.
    // -----------------------------------------------------------------------

    // Create a pivot table based on the worksheet data and summarize the
    // "Volume" data by "Region". Note that the data source can also be
    // specified as a tuple.
    let pivot_table = PivotTable::new()
        .set_data_source(("Data", 0, 0, 50, 3))
        .add_row_field("Region")
        .add_value_field(&PivotTableValueField::new("Volume"));

    // Add the pivot table to a new worksheet.
    let worksheet = workbook.add_worksheet().set_name("Pivot2")?;
    worksheet.add_pivot_table(2, 0, &pivot_table)?;

    // -----------------------------------------------------------------------
    // 3. Add a pivot table with a Row field, a Column field and a Value field.
    // -----------------------------------------------------------------------

    // Create a pivot table based on the worksheet data and summarize the
    // "Volume" data by "Region" and "Item".
    let pivot_table = PivotTable::new()
        .set_data_source("Data!A1:D51")
        .add_row_field("Region")
        .add_column_field("Item")
        .add_value_field(&PivotTableValueField::new("Volume"));

    // Add the pivot table to a new worksheet.
    let worksheet = workbook.add_worksheet().set_name("Pivot3")?;
    worksheet.add_pivot_table(2, 0, &pivot_table)?;

    // -----------------------------------------------------------------------
    // 4. Add a pivot table with a Filter field.
    // -----------------------------------------------------------------------

    // Create a pivot table based on the worksheet data and summarize the
    // "Volume" data by "Region", with a filter on "Month".
    let pivot_table = PivotTable::new()
        .set_data_source("Data!A1:D51")
        .add_row_field("Region")
        .add_value_field(&PivotTableValueField::new("Volume"))
        .add_filter_field("Month");

    // Add the pivot table to a new worksheet. The filter is displayed in the
    // first row and the pivot table body starts in the third row.
    let worksheet = workbook.add_worksheet().set_name("Pivot4")?;
    worksheet.add_pivot_table(0, 0, &pivot_table)?;

    // -----------------------------------------------------------------------
    // 5. Add a pivot table with two Row fields.
    // -----------------------------------------------------------------------

    // Create a pivot table based on the worksheet data and summarize the
    // "Volume" data by "Region" and then by "Item" within each region.
    let pivot_table = PivotTable::new()
        .set_data_source("Data!A1:D51")
        .add_row_field("Region")
        .add_row_field("Item")
        .add_value_field(&PivotTableValueField::new("Volume"));

    // Add the pivot table to a new worksheet.
    let worksheet = workbook.add_worksheet().set_name("Pivot5")?;
    worksheet.add_pivot_table(2, 0, &pivot_table)?;

    // -----------------------------------------------------------------------
    // 6. Add a pivot table with several Value fields.
    // -----------------------------------------------------------------------

    // Create a pivot table based on the worksheet data and summarize the
    // "Volume" data by "Region" using different functions.
    let pivot_table = PivotTable::new()
        .set_data_source("Data!A1:D51")
        .add_row_field("Region")
        .add_value_field(&PivotTableValueField::new("Volume"))
        .add_value_field(
            &PivotTableValueField::new("Volume").set_function(PivotTableFunction::Count),
        )
        .add_value_field(
            &PivotTableValueField::new("Volume").set_function(PivotTableFunction::Average),
        );

    // Add the pivot table to a new worksheet.
    let worksheet = workbook.add_worksheet().set_name("Pivot6")?;
    worksheet.add_pivot_table(2, 0, &pivot_table)?;

    // -----------------------------------------------------------------------
    // 7. Add a pivot table with a custom name and number format.
    // -----------------------------------------------------------------------

    // Create a pivot table based on the worksheet data and summarize the
    // "Volume" data by "Region", with a custom name and number format.
    let pivot_table = PivotTable::new()
        .set_data_source("Data!A1:D51")
        .add_row_field("Region")
        .add_value_field(
            &PivotTableValueField::new("Volume")
                .set_custom_name("Total Volume")
                .set_num_format("#,##0"),
        );

    // Add the pivot table to a new worksheet.
    let worksheet = workbook.add_worksheet().set_name("Pivot7")?;
    worksheet.add_pivot_table(2, 0, &pivot_table)?;

    // -----------------------------------------------------------------------
    // 8. Add a pivot table with a different style and no grand totals.
    // -----------------------------------------------------------------------

    // Create a pivot table based on the worksheet data and summarize the
    // "Volume" data by "Region" and "Item", without grand totals.
    let pivot_table = PivotTable::new()
        .set_data_source("Data!A1:D51")
        .add_row_field("Region")
        .add_column_field("Item")
        .add_value_field(&PivotTableValueField::new("Volume"))
        .set_style(PivotTableStyle::Medium9)
        .set_row_grand_totals(false)
        .set_column_grand_totals(false);

    // Add the pivot table to a new worksheet.
    let worksheet = workbook.add_worksheet().set_name("Pivot8")?;
    worksheet.add_pivot_table(2, 0, &pivot_table)?;

    // -----------------------------------------------------------------------
    // 9. Add a pivot table with a tabular layout.
    // -----------------------------------------------------------------------

    // Create a pivot table based on the worksheet data and summarize the
    // "Volume" data by "Region" and "Item", with each row field in its own
    // column.
    let pivot_table = PivotTable::new()
        .set_data_source("Data!A1:D51")
        .add_row_field("Region")
        .add_row_field("Item")
        .add_value_field(&PivotTableValueField::new("Volume"))
        .set_layout(PivotTableLayout::Tabular);

    // Add the pivot table to a new worksheet.
    let worksheet = workbook.add_worksheet().set_name("Pivot9")?;
    worksheet.add_pivot_table(2, 0, &pivot_table)?;

    // -----------------------------------------------------------------------
    // 10. Add two pivot tables to the same worksheet.
    // -----------------------------------------------------------------------

    // Create two pivot tables based on the worksheet data and summarize the
    // "Volume" data by "Region" in one and by "Item" in the other.
    let pivot_table1 = PivotTable::new()
        .set_data_source("Data!A1:D51")
        .add_row_field("Region")
        .add_value_field(&PivotTableValueField::new("Volume"));

    let pivot_table2 = PivotTable::new()
        .set_data_source("Data!A1:D51")
        .add_row_field("Item")
        .add_value_field(&PivotTableValueField::new("Volume"));

    // Add the pivot tables side by side on a new worksheet.
    let worksheet = workbook.add_worksheet().set_name("Pivot10")?;
    worksheet.add_pivot_table(2, 0, &pivot_table1)?;
    worksheet.add_pivot_table(2, 5, &pivot_table2)?;

    // -----------------------------------------------------------------------
    // 11. Add a pivot table to the same worksheet as the data.
    // -----------------------------------------------------------------------

    // Add a new worksheet with a copy of the sample data.
    let worksheet = workbook.add_worksheet().set_name("Pivot11")?;
    populate_pivot_data(worksheet)?;

    // Create a pivot table based on the data in the same worksheet and
    // summarize the "Volume" data by "Region".
    let pivot_table = PivotTable::new()
        .set_data_source("Pivot11!A1:D51")
        .add_row_field("Region")
        .add_value_field(&PivotTableValueField::new("Volume"));

    // Add the pivot table to the right of the data.
    worksheet.add_pivot_table(2, 6, &pivot_table)?;

    // Save the file to disk.
    workbook.save("pivot_table.xlsx")?;

    Ok(())
}

// Generate worksheet data for the pivot tables.
pub fn populate_pivot_data(worksheet: &mut Worksheet) -> Result<(), XlsxError> {
    // The sample data to add to the worksheet.
    let data = [
        ("East", "Apple", 9000, "July"),
        ("East", "Apple", 5000, "April"),
        ("South", "Orange", 9000, "September"),
        ("North", "Apple", 2000, "November"),
        ("West", "Apple", 9000, "November"),
        ("South", "Pear", 7000, "October"),
        ("North", "Pear", 9000, "August"),
        ("West", "Orange", 1000, "December"),
        ("West", "Grape", 1000, "November"),
        ("South", "Pear", 10000, "April"),
        ("West", "Grape", 6000, "January"),
        ("South", "Orange", 3000, "May"),
        ("North", "Apple", 3000, "December"),
        ("South", "Apple", 7000, "February"),
        ("West", "Grape", 1000, "December"),
        ("East", "Grape", 8000, "February"),
        ("South", "Grape", 10000, "June"),
        ("West", "Pear", 7000, "December"),
        ("South", "Apple", 2000, "October"),
        ("East", "Grape", 7000, "December"),
        ("North", "Grape", 6000, "July"),
        ("East", "Pear", 8000, "February"),
        ("North", "Apple", 7000, "August"),
        ("North", "Orange", 7000, "July"),
        ("North", "Apple", 6000, "June"),
        ("South", "Grape", 8000, "September"),
        ("West", "Apple", 3000, "October"),
        ("South", "Orange", 10000, "November"),
        ("West", "Grape", 4000, "December"),
        ("North", "Orange", 5000, "August"),
        ("East", "Orange", 1000, "November"),
        ("East", "Orange", 4000, "October"),
        ("North", "Grape", 5000, "August"),
        ("East", "Apple", 1000, "July"),
        ("South", "Apple", 10000, "March"),
        ("East", "Grape", 7000, "October"),
        ("West", "Grape", 1000, "September"),
        ("East", "Grape", 10000, "October"),
        ("South", "Orange", 8000, "March"),
        ("North", "Apple", 4000, "July"),
        ("South", "Orange", 5000, "July"),
        ("West", "Apple", 4000, "June"),
        ("East", "Apple", 5000, "April"),
        ("North", "Pear", 3000, "August"),
        ("East", "Grape", 9000, "November"),
        ("North", "Orange", 8000, "October"),
        ("East", "Apple", 10000, "June"),
        ("South", "Pear", 1000, "December"),
        ("North", "Grape", 10000, "July"),
        ("East", "Grape", 6000, "February"),
    ];

    // Widen the columns for clarity.
    worksheet.set_column_width(0, 12)?;
    worksheet.set_column_width(1, 12)?;
    worksheet.set_column_width(2, 12)?;
    worksheet.set_column_width(3, 12)?;

    // Write the header titles.
    let header_format = Format::new().set_bold();
    worksheet.write_string_with_format(0, 0, "Region", &header_format)?;
    worksheet.write_string_with_format(0, 1, "Item", &header_format)?;
    worksheet.write_string_with_format(0, 2, "Volume", &header_format)?;
    worksheet.write_string_with_format(0, 3, "Month", &header_format)?;

    // Write the other worksheet data.
    for (row, data) in data.iter().enumerate() {
        let row = 1 + row as u32;
        worksheet.write_string(row, 0, data.0)?;
        worksheet.write_string(row, 1, data.1)?;
        worksheet.write_number(row, 2, data.2)?;
        worksheet.write_string(row, 3, data.3)?;
    }

    Ok(())
}
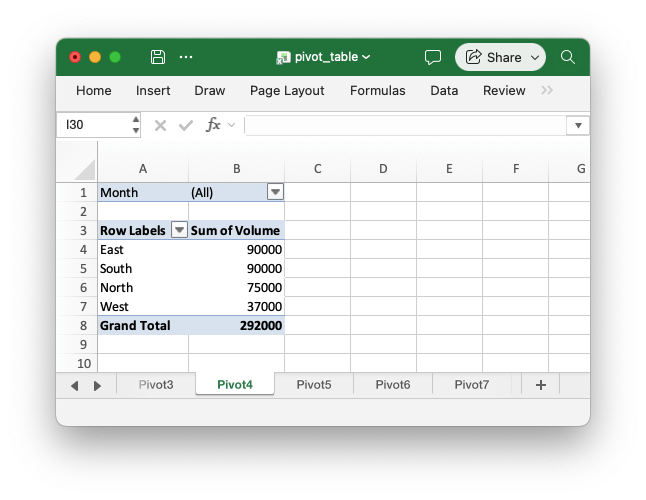
Example 4. Pivot table with a filter field.
Code to generate the above example:
// SPDX-License-Identifier: MIT OR Apache-2.0
//
// Copyright 2022-2026, John McNamara, jmcnamara@cpan.org

//! An example of how to create pivot tables with the `rust_xlsxwriter` library.
//!
//! A pivot table is a way of grouping and summarizing the data in a worksheet
//! range.
//!

use rust_xlsxwriter::{
    Format, PivotTable, PivotTableFunction, PivotTableLayout, PivotTableStyle,
    PivotTableValueField, Workbook, Worksheet, XlsxError,
};

fn main() -> Result<(), XlsxError> {
    // Create a new Excel file object.
    let mut workbook = Workbook::new();

    // Add a worksheet with some sample data for the pivot tables.
    let worksheet = workbook.add_worksheet().set_name("Data")?;
    populate_pivot_data(worksheet)?;

    // -----------------------------------------------------------------------
    // 1. Add an empty pivot table.
    // -----------------------------------------------------------------------

    // Create a pivot table based on the worksheet data.
    let pivot_table = PivotTable::new().set_data_source("Data!A1:D51");

    // Add the pivot table to a new worksheet.
    let worksheet = workbook.add_worksheet().set_name("Pivot1")?;
    worksheet.add_pivot_table(2, 0, &pivot_table)?;

    // -----------------------------------------------------------------------
    // 2. Add a pivot table with a Row field and a Value field.
    // -----------------------------------------------------------------------

    // Create a pivot table based on the worksheet data and summarize the
    // "Volume" data by "Region". Note that the data source can also be
    // specified as a tuple.
    let pivot_table = PivotTable::new()
        .set_data_source(("Data", 0, 0, 50, 3))
        .add_row_field("Region")
        .add_value_field(&PivotTableValueField::new("Volume"));

    // Add the pivot table to a new worksheet.
    let worksheet = workbook.add_worksheet().set_name("Pivot2")?;
    worksheet.add_pivot_table(2, 0, &pivot_table)?;

    // -----------------------------------------------------------------------
    // 3. Add a pivot table with a Row field, a Column field and a Value field.
    // -----------------------------------------------------------------------

    // Create a pivot table based on the worksheet data and summarize the
    // "Volume" data by "Region" and "Item".
    let pivot_table = PivotTable::new()
        .set_data_source("Data!A1:D51")
        .add_row_field("Region")
        .add_column_field("Item")
        .add_value_field(&PivotTableValueField::new("Volume"));

    // Add the pivot table to a new worksheet.
    let worksheet = workbook.add_worksheet().set_name("Pivot3")?;
    worksheet.add_pivot_table(2, 0, &pivot_table)?;

    // -----------------------------------------------------------------------
    // 4. Add a pivot table with a Filter field.
    // -----------------------------------------------------------------------

    // Create a pivot table based on the worksheet data and summarize the
    // "Volume" data by "Region", with a filter on "Month".
    let pivot_table = PivotTable::new()
        .set_data_source("Data!A1:D51")
        .add_row_field("Region")
        .add_value_field(&PivotTableValueField::new("Volume"))
        .add_filter_field("Month");

    // Add the pivot table to a new worksheet. The filter is displayed in the
    // first row and the pivot table body starts in the third row.
    let worksheet = workbook.add_worksheet().set_name("Pivot4")?;
    worksheet.add_pivot_table(0, 0, &pivot_table)?;

    // -----------------------------------------------------------------------
    // 5. Add a pivot table with two Row fields.
    // -----------------------------------------------------------------------

    // Create a pivot table based on the worksheet data and summarize the
    // "Volume" data by "Region" and then by "Item" within each region.
    let pivot_table = PivotTable::new()
        .set_data_source("Data!A1:D51")
        .add_row_field("Region")
        .add_row_field("Item")
        .add_value_field(&PivotTableValueField::new("Volume"));

    // Add the pivot table to a new worksheet.
    let worksheet = workbook.add_worksheet().set_name("Pivot5")?;
    worksheet.add_pivot_table(2, 0, &pivot_table)?;

    // -----------------------------------------------------------------------
    // 6. Add a pivot table with several Value fields.
    // -----------------------------------------------------------------------

    // Create a pivot table based on the worksheet data and summarize the
    // "Volume" data by "Region" using different functions.
    let pivot_table = PivotTable::new()
        .set_data_source("Data!A1:D51")
        .add_row_field("Region")
        .add_value_field(&PivotTableValueField::new("Volume"))
        .add_value_field(
            &PivotTableValueField::new("Volume").set_function(PivotTableFunction::Count),
        )
        .add_value_field(
            &PivotTableValueField::new("Volume").set_function(PivotTableFunction::Average),
        );

    // Add the pivot table to a new worksheet.
    let worksheet = workbook.add_worksheet().set_name("Pivot6")?;
    worksheet.add_pivot_table(2, 0, &pivot_table)?;

    // -----------------------------------------------------------------------
    // 7. Add a pivot table with a custom name and number format.
    // -----------------------------------------------------------------------

    // Create a pivot table based on the worksheet data and summarize the
    // "Volume" data by "Region", with a custom name and number format.
    let pivot_table = PivotTable::new()
        .set_data_source("Data!A1:D51")
        .add_row_field("Region")
        .add_value_field(
            &PivotTableValueField::new("Volume")
                .set_custom_name("Total Volume")
                .set_num_format("#,##0"),
        );

    // Add the pivot table to a new worksheet.
    let worksheet = workbook.add_worksheet().set_name("Pivot7")?;
    worksheet.add_pivot_table(2, 0, &pivot_table)?;

    // -----------------------------------------------------------------------
    // 8. Add a pivot table with a different style and no grand totals.
    // -----------------------------------------------------------------------

    // Create a pivot table based on the worksheet data and summarize the
    // "Volume" data by "Region" and "Item", without grand totals.
    let pivot_table = PivotTable::new()
        .set_data_source("Data!A1:D51")
        .add_row_field("Region")
        .add_column_field("Item")
        .add_value_field(&PivotTableValueField::new("Volume"))
        .set_style(PivotTableStyle::Medium9)
        .set_row_grand_totals(false)
        .set_column_grand_totals(false);

    // Add the pivot table to a new worksheet.
    let worksheet = workbook.add_worksheet().set_name("Pivot8")?;
    worksheet.add_pivot_table(2, 0, &pivot_table)?;

    // -----------------------------------------------------------------------
    // 9. Add a pivot table with a tabular layout.
    // -----------------------------------------------------------------------

    // Create a pivot table based on the worksheet data and summarize the
    // "Volume" data by "Region" and "Item", with each row field in its own
    // column.
    let pivot_table = PivotTable::new()
        .set_data_source("Data!A1:D51")
        .add_row_field("Region")
        .add_row_field("Item")
        .add_value_field(&PivotTableValueField::new("Volume"))
        .set_layout(PivotTableLayout::Tabular);

    // Add the pivot table to a new worksheet.
    let worksheet = workbook.add_worksheet().set_name("Pivot9")?;
    worksheet.add_pivot_table(2, 0, &pivot_table)?;

    // -----------------------------------------------------------------------
    // 10. Add two pivot tables to the same worksheet.
    // -----------------------------------------------------------------------

    // Create two pivot tables based on the worksheet data and summarize the
    // "Volume" data by "Region" in one and by "Item" in the other.
    let pivot_table1 = PivotTable::new()
        .set_data_source("Data!A1:D51")
        .add_row_field("Region")
        .add_value_field(&PivotTableValueField::new("Volume"));

    let pivot_table2 = PivotTable::new()
        .set_data_source("Data!A1:D51")
        .add_row_field("Item")
        .add_value_field(&PivotTableValueField::new("Volume"));

    // Add the pivot tables side by side on a new worksheet.
    let worksheet = workbook.add_worksheet().set_name("Pivot10")?;
    worksheet.add_pivot_table(2, 0, &pivot_table1)?;
    worksheet.add_pivot_table(2, 5, &pivot_table2)?;

    // -----------------------------------------------------------------------
    // 11. Add a pivot table to the same worksheet as the data.
    // -----------------------------------------------------------------------

    // Add a new worksheet with a copy of the sample data.
    let worksheet = workbook.add_worksheet().set_name("Pivot11")?;
    populate_pivot_data(worksheet)?;

    // Create a pivot table based on the data in the same worksheet and
    // summarize the "Volume" data by "Region".
    let pivot_table = PivotTable::new()
        .set_data_source("Pivot11!A1:D51")
        .add_row_field("Region")
        .add_value_field(&PivotTableValueField::new("Volume"));

    // Add the pivot table to the right of the data.
    worksheet.add_pivot_table(2, 6, &pivot_table)?;

    // Save the file to disk.
    workbook.save("pivot_table.xlsx")?;

    Ok(())
}

// Generate worksheet data for the pivot tables.
pub fn populate_pivot_data(worksheet: &mut Worksheet) -> Result<(), XlsxError> {
    // The sample data to add to the worksheet.
    let data = [
        ("East", "Apple", 9000, "July"),
        ("East", "Apple", 5000, "April"),
        ("South", "Orange", 9000, "September"),
        ("North", "Apple", 2000, "November"),
        ("West", "Apple", 9000, "November"),
        ("South", "Pear", 7000, "October"),
        ("North", "Pear", 9000, "August"),
        ("West", "Orange", 1000, "December"),
        ("West", "Grape", 1000, "November"),
        ("South", "Pear", 10000, "April"),
        ("West", "Grape", 6000, "January"),
        ("South", "Orange", 3000, "May"),
        ("North", "Apple", 3000, "December"),
        ("South", "Apple", 7000, "February"),
        ("West", "Grape", 1000, "December"),
        ("East", "Grape", 8000, "February"),
        ("South", "Grape", 10000, "June"),
        ("West", "Pear", 7000, "December"),
        ("South", "Apple", 2000, "October"),
        ("East", "Grape", 7000, "December"),
        ("North", "Grape", 6000, "July"),
        ("East", "Pear", 8000, "February"),
        ("North", "Apple", 7000, "August"),
        ("North", "Orange", 7000, "July"),
        ("North", "Apple", 6000, "June"),
        ("South", "Grape", 8000, "September"),
        ("West", "Apple", 3000, "October"),
        ("South", "Orange", 10000, "November"),
        ("West", "Grape", 4000, "December"),
        ("North", "Orange", 5000, "August"),
        ("East", "Orange", 1000, "November"),
        ("East", "Orange", 4000, "October"),
        ("North", "Grape", 5000, "August"),
        ("East", "Apple", 1000, "July"),
        ("South", "Apple", 10000, "March"),
        ("East", "Grape", 7000, "October"),
        ("West", "Grape", 1000, "September"),
        ("East", "Grape", 10000, "October"),
        ("South", "Orange", 8000, "March"),
        ("North", "Apple", 4000, "July"),
        ("South", "Orange", 5000, "July"),
        ("West", "Apple", 4000, "June"),
        ("East", "Apple", 5000, "April"),
        ("North", "Pear", 3000, "August"),
        ("East", "Grape", 9000, "November"),
        ("North", "Orange", 8000, "October"),
        ("East", "Apple", 10000, "June"),
        ("South", "Pear", 1000, "December"),
        ("North", "Grape", 10000, "July"),
        ("East", "Grape", 6000, "February"),
    ];

    // Widen the columns for clarity.
    worksheet.set_column_width(0, 12)?;
    worksheet.set_column_width(1, 12)?;
    worksheet.set_column_width(2, 12)?;
    worksheet.set_column_width(3, 12)?;

    // Write the header titles.
    let header_format = Format::new().set_bold();
    worksheet.write_string_with_format(0, 0, "Region", &header_format)?;
    worksheet.write_string_with_format(0, 1, "Item", &header_format)?;
    worksheet.write_string_with_format(0, 2, "Volume", &header_format)?;
    worksheet.write_string_with_format(0, 3, "Month", &header_format)?;

    // Write the other worksheet data.
    for (row, data) in data.iter().enumerate() {
        let row = 1 + row as u32;
        worksheet.write_string(row, 0, data.0)?;
        worksheet.write_string(row, 1, data.1)?;
        worksheet.write_number(row, 2, data.2)?;
        worksheet.write_string(row, 3, data.3)?;
    }

    Ok(())
}
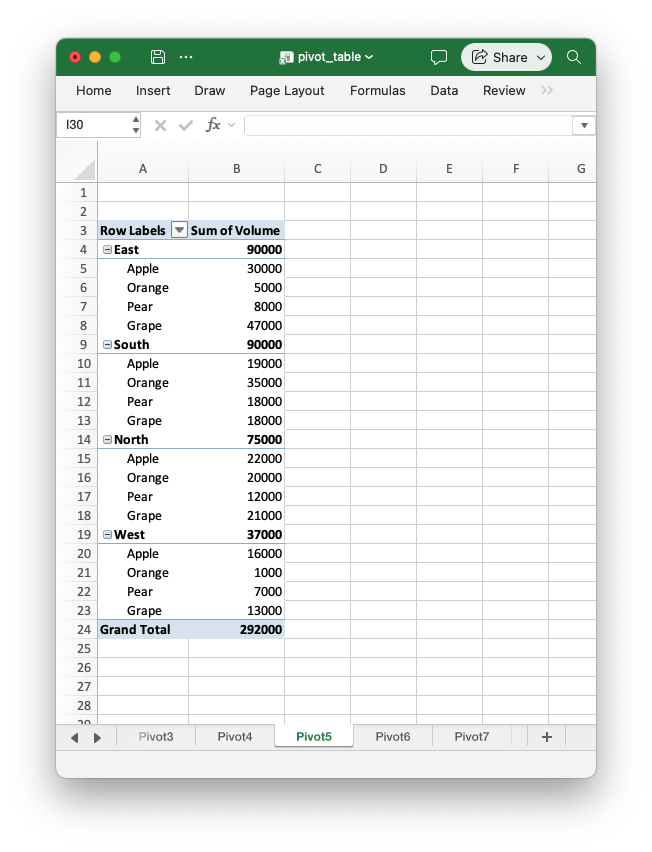
Example 5. Pivot table with two row fields.
Code to generate the above example:
// SPDX-License-Identifier: MIT OR Apache-2.0
//
// Copyright 2022-2026, John McNamara, jmcnamara@cpan.org

//! An example of how to create pivot tables with the `rust_xlsxwriter` library.
//!
//! A pivot table is a way of grouping and summarizing the data in a worksheet
//! range.
//!

use rust_xlsxwriter::{
    Format, PivotTable, PivotTableFunction, PivotTableLayout, PivotTableStyle,
    PivotTableValueField, Workbook, Worksheet, XlsxError,
};

fn main() -> Result<(), XlsxError> {
    // Create a new Excel file object.
    let mut workbook = Workbook::new();

    // Add a worksheet with some sample data for the pivot tables.
    let worksheet = workbook.add_worksheet().set_name("Data")?;
    populate_pivot_data(worksheet)?;

    // -----------------------------------------------------------------------
    // 1. Add an empty pivot table.
    // -----------------------------------------------------------------------

    // Create a pivot table based on the worksheet data.
    let pivot_table = PivotTable::new().set_data_source("Data!A1:D51");

    // Add the pivot table to a new worksheet.
    let worksheet = workbook.add_worksheet().set_name("Pivot1")?;
    worksheet.add_pivot_table(2, 0, &pivot_table)?;

    // -----------------------------------------------------------------------
    // 2. Add a pivot table with a Row field and a Value field.
    // -----------------------------------------------------------------------

    // Create a pivot table based on the worksheet data and summarize the
    // "Volume" data by "Region". Note that the data source can also be
    // specified as a tuple.
    let pivot_table = PivotTable::new()
        .set_data_source(("Data", 0, 0, 50, 3))
        .add_row_field("Region")
        .add_value_field(&PivotTableValueField::new("Volume"));

    // Add the pivot table to a new worksheet.
    let worksheet = workbook.add_worksheet().set_name("Pivot2")?;
    worksheet.add_pivot_table(2, 0, &pivot_table)?;

    // -----------------------------------------------------------------------
    // 3. Add a pivot table with a Row field, a Column field and a Value field.
    // -----------------------------------------------------------------------

    // Create a pivot table based on the worksheet data and summarize the
    // "Volume" data by "Region" and "Item".
    let pivot_table = PivotTable::new()
        .set_data_source("Data!A1:D51")
        .add_row_field("Region")
        .add_column_field("Item")
        .add_value_field(&PivotTableValueField::new("Volume"));

    // Add the pivot table to a new worksheet.
    let worksheet = workbook.add_worksheet().set_name("Pivot3")?;
    worksheet.add_pivot_table(2, 0, &pivot_table)?;

    // -----------------------------------------------------------------------
    // 4. Add a pivot table with a Filter field.
    // -----------------------------------------------------------------------

    // Create a pivot table based on the worksheet data and summarize the
    // "Volume" data by "Region", with a filter on "Month".
    let pivot_table = PivotTable::new()
        .set_data_source("Data!A1:D51")
        .add_row_field("Region")
        .add_value_field(&PivotTableValueField::new("Volume"))
        .add_filter_field("Month");

    // Add the pivot table to a new worksheet. The filter is displayed in the
    // first row and the pivot table body starts in the third row.
    let worksheet = workbook.add_worksheet().set_name("Pivot4")?;
    worksheet.add_pivot_table(0, 0, &pivot_table)?;

    // -----------------------------------------------------------------------
    // 5. Add a pivot table with two Row fields.
    // -----------------------------------------------------------------------

    // Create a pivot table based on the worksheet data and summarize the
    // "Volume" data by "Region" and then by "Item" within each region.
    let pivot_table = PivotTable::new()
        .set_data_source("Data!A1:D51")
        .add_row_field("Region")
        .add_row_field("Item")
        .add_value_field(&PivotTableValueField::new("Volume"));

    // Add the pivot table to a new worksheet.
    let worksheet = workbook.add_worksheet().set_name("Pivot5")?;
    worksheet.add_pivot_table(2, 0, &pivot_table)?;

    // -----------------------------------------------------------------------
    // 6. Add a pivot table with several Value fields.
    // -----------------------------------------------------------------------

    // Create a pivot table based on the worksheet data and summarize the
    // "Volume" data by "Region" using different functions.
    let pivot_table = PivotTable::new()
        .set_data_source("Data!A1:D51")
        .add_row_field("Region")
        .add_value_field(&PivotTableValueField::new("Volume"))
        .add_value_field(
            &PivotTableValueField::new("Volume").set_function(PivotTableFunction::Count),
        )
        .add_value_field(
            &PivotTableValueField::new("Volume").set_function(PivotTableFunction::Average),
        );

    // Add the pivot table to a new worksheet.
    let worksheet = workbook.add_worksheet().set_name("Pivot6")?;
    worksheet.add_pivot_table(2, 0, &pivot_table)?;

    // -----------------------------------------------------------------------
    // 7. Add a pivot table with a custom name and number format.
    // -----------------------------------------------------------------------

    // Create a pivot table based on the worksheet data and summarize the
    // "Volume" data by "Region", with a custom name and number format.
    let pivot_table = PivotTable::new()
        .set_data_source("Data!A1:D51")
        .add_row_field("Region")
        .add_value_field(
            &PivotTableValueField::new("Volume")
                .set_custom_name("Total Volume")
                .set_num_format("#,##0"),
        );

    // Add the pivot table to a new worksheet.
    let worksheet = workbook.add_worksheet().set_name("Pivot7")?;
    worksheet.add_pivot_table(2, 0, &pivot_table)?;

    // -----------------------------------------------------------------------
    // 8. Add a pivot table with a different style and no grand totals.
    // -----------------------------------------------------------------------

    // Create a pivot table based on the worksheet data and summarize the
    // "Volume" data by "Region" and "Item", without grand totals.
    let pivot_table = PivotTable::new()
        .set_data_source("Data!A1:D51")
        .add_row_field("Region")
        .add_column_field("Item")
        .add_value_field(&PivotTableValueField::new("Volume"))
        .set_style(PivotTableStyle::Medium9)
        .set_row_grand_totals(false)
        .set_column_grand_totals(false);

    // Add the pivot table to a new worksheet.
    let worksheet = workbook.add_worksheet().set_name("Pivot8")?;
    worksheet.add_pivot_table(2, 0, &pivot_table)?;

    // -----------------------------------------------------------------------
    // 9. Add a pivot table with a tabular layout.
    // -----------------------------------------------------------------------

    // Create a pivot table based on the worksheet data and summarize the
    // "Volume" data by "Region" and "Item", with each row field in its own
    // column.
    let pivot_table = PivotTable::new()
        .set_data_source("Data!A1:D51")
        .add_row_field("Region")
        .add_row_field("Item")
        .add_value_field(&PivotTableValueField::new("Volume"))
        .set_layout(PivotTableLayout::Tabular);

    // Add the pivot table to a new worksheet.
    let worksheet = workbook.add_worksheet().set_name("Pivot9")?;
    worksheet.add_pivot_table(2, 0, &pivot_table)?;

    // -----------------------------------------------------------------------
    // 10. Add two pivot tables to the same worksheet.
    // -----------------------------------------------------------------------

    // Create two pivot tables based on the worksheet data and summarize the
    // "Volume" data by "Region" in one and by "Item" in the other.
    let pivot_table1 = PivotTable::new()
        .set_data_source("Data!A1:D51")
        .add_row_field("Region")
        .add_value_field(&PivotTableValueField::new("Volume"));

    let pivot_table2 = PivotTable::new()
        .set_data_source("Data!A1:D51")
        .add_row_field("Item")
        .add_value_field(&PivotTableValueField::new("Volume"));

    // Add the pivot tables side by side on a new worksheet.
    let worksheet = workbook.add_worksheet().set_name("Pivot10")?;
    worksheet.add_pivot_table(2, 0, &pivot_table1)?;
    worksheet.add_pivot_table(2, 5, &pivot_table2)?;

    // -----------------------------------------------------------------------
    // 11. Add a pivot table to the same worksheet as the data.
    // -----------------------------------------------------------------------

    // Add a new worksheet with a copy of the sample data.
    let worksheet = workbook.add_worksheet().set_name("Pivot11")?;
    populate_pivot_data(worksheet)?;

    // Create a pivot table based on the data in the same worksheet and
    // summarize the "Volume" data by "Region".
    let pivot_table = PivotTable::new()
        .set_data_source("Pivot11!A1:D51")
        .add_row_field("Region")
        .add_value_field(&PivotTableValueField::new("Volume"));

    // Add the pivot table to the right of the data.
    worksheet.add_pivot_table(2, 6, &pivot_table)?;

    // Save the file to disk.
    workbook.save("pivot_table.xlsx")?;

    Ok(())
}

// Generate worksheet data for the pivot tables.
pub fn populate_pivot_data(worksheet: &mut Worksheet) -> Result<(), XlsxError> {
    // The sample data to add to the worksheet.
    let data = [
        ("East", "Apple", 9000, "July"),
        ("East", "Apple", 5000, "April"),
        ("South", "Orange", 9000, "September"),
        ("North", "Apple", 2000, "November"),
        ("West", "Apple", 9000, "November"),
        ("South", "Pear", 7000, "October"),
        ("North", "Pear", 9000, "August"),
        ("West", "Orange", 1000, "December"),
        ("West", "Grape", 1000, "November"),
        ("South", "Pear", 10000, "April"),
        ("West", "Grape", 6000, "January"),
        ("South", "Orange", 3000, "May"),
        ("North", "Apple", 3000, "December"),
        ("South", "Apple", 7000, "February"),
        ("West", "Grape", 1000, "December"),
        ("East", "Grape", 8000, "February"),
        ("South", "Grape", 10000, "June"),
        ("West", "Pear", 7000, "December"),
        ("South", "Apple", 2000, "October"),
        ("East", "Grape", 7000, "December"),
        ("North", "Grape", 6000, "July"),
        ("East", "Pear", 8000, "February"),
        ("North", "Apple", 7000, "August"),
        ("North", "Orange", 7000, "July"),
        ("North", "Apple", 6000, "June"),
        ("South", "Grape", 8000, "September"),
        ("West", "Apple", 3000, "October"),
        ("South", "Orange", 10000, "November"),
        ("West", "Grape", 4000, "December"),
        ("North", "Orange", 5000, "August"),
        ("East", "Orange", 1000, "November"),
        ("East", "Orange", 4000, "October"),
        ("North", "Grape", 5000, "August"),
        ("East", "Apple", 1000, "July"),
        ("South", "Apple", 10000, "March"),
        ("East", "Grape", 7000, "October"),
        ("West", "Grape", 1000, "September"),
        ("East", "Grape", 10000, "October"),
        ("South", "Orange", 8000, "March"),
        ("North", "Apple", 4000, "July"),
        ("South", "Orange", 5000, "July"),
        ("West", "Apple", 4000, "June"),
        ("East", "Apple", 5000, "April"),
        ("North", "Pear", 3000, "August"),
        ("East", "Grape", 9000, "November"),
        ("North", "Orange", 8000, "October"),
        ("East", "Apple", 10000, "June"),
        ("South", "Pear", 1000, "December"),
        ("North", "Grape", 10000, "July"),
        ("East", "Grape", 6000, "February"),
    ];

    // Widen the columns for clarity.
    worksheet.set_column_width(0, 12)?;
    worksheet.set_column_width(1, 12)?;
    worksheet.set_column_width(2, 12)?;
    worksheet.set_column_width(3, 12)?;

    // Write the header titles.
    let header_format = Format::new().set_bold();
    worksheet.write_string_with_format(0, 0, "Region", &header_format)?;
    worksheet.write_string_with_format(0, 1, "Item", &header_format)?;
    worksheet.write_string_with_format(0, 2, "Volume", &header_format)?;
    worksheet.write_string_with_format(0, 3, "Month", &header_format)?;

    // Write the other worksheet data.
    for (row, data) in data.iter().enumerate() {
        let row = 1 + row as u32;
        worksheet.write_string(row, 0, data.0)?;
        worksheet.write_string(row, 1, data.1)?;
        worksheet.write_number(row, 2, data.2)?;
        worksheet.write_string(row, 3, data.3)?;
    }

    Ok(())
}
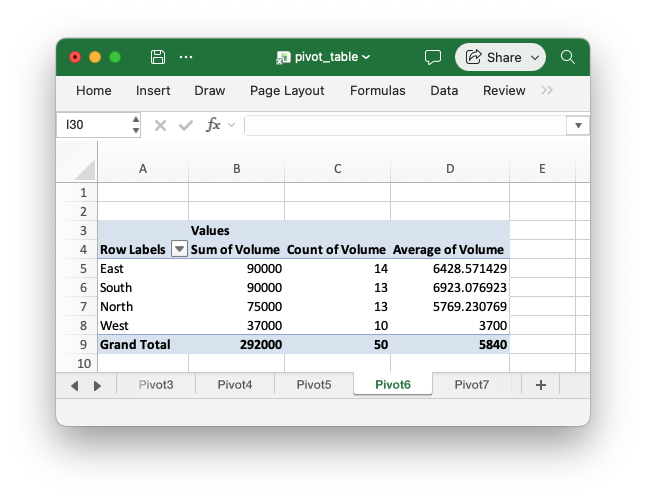
Example 6. Pivot table with several value fields that use different functions.
Code to generate the above example:
// SPDX-License-Identifier: MIT OR Apache-2.0
//
// Copyright 2022-2026, John McNamara, jmcnamara@cpan.org

//! An example of how to create pivot tables with the `rust_xlsxwriter` library.
//!
//! A pivot table is a way of grouping and summarizing the data in a worksheet
//! range.
//!

use rust_xlsxwriter::{
    Format, PivotTable, PivotTableFunction, PivotTableLayout, PivotTableStyle,
    PivotTableValueField, Workbook, Worksheet, XlsxError,
};

fn main() -> Result<(), XlsxError> {
    // Create a new Excel file object.
    let mut workbook = Workbook::new();

    // Add a worksheet with some sample data for the pivot tables.
    let worksheet = workbook.add_worksheet().set_name("Data")?;
    populate_pivot_data(worksheet)?;

    // -----------------------------------------------------------------------
    // 1. Add an empty pivot table.
    // -----------------------------------------------------------------------

    // Create a pivot table based on the worksheet data.
    let pivot_table = PivotTable::new().set_data_source("Data!A1:D51");

    // Add the pivot table to a new worksheet.
    let worksheet = workbook.add_worksheet().set_name("Pivot1")?;
    worksheet.add_pivot_table(2, 0, &pivot_table)?;

    // -----------------------------------------------------------------------
    // 2. Add a pivot table with a Row field and a Value field.
    // -----------------------------------------------------------------------

    // Create a pivot table based on the worksheet data and summarize the
    // "Volume" data by "Region". Note that the data source can also be
    // specified as a tuple.
    let pivot_table = PivotTable::new()
        .set_data_source(("Data", 0, 0, 50, 3))
        .add_row_field("Region")
        .add_value_field(&PivotTableValueField::new("Volume"));

    // Add the pivot table to a new worksheet.
    let worksheet = workbook.add_worksheet().set_name("Pivot2")?;
    worksheet.add_pivot_table(2, 0, &pivot_table)?;

    // -----------------------------------------------------------------------
    // 3. Add a pivot table with a Row field, a Column field and a Value field.
    // -----------------------------------------------------------------------

    // Create a pivot table based on the worksheet data and summarize the
    // "Volume" data by "Region" and "Item".
    let pivot_table = PivotTable::new()
        .set_data_source("Data!A1:D51")
        .add_row_field("Region")
        .add_column_field("Item")
        .add_value_field(&PivotTableValueField::new("Volume"));

    // Add the pivot table to a new worksheet.
    let worksheet = workbook.add_worksheet().set_name("Pivot3")?;
    worksheet.add_pivot_table(2, 0, &pivot_table)?;

    // -----------------------------------------------------------------------
    // 4. Add a pivot table with a Filter field.
    // -----------------------------------------------------------------------

    // Create a pivot table based on the worksheet data and summarize the
    // "Volume" data by "Region", with a filter on "Month".
    let pivot_table = PivotTable::new()
        .set_data_source("Data!A1:D51")
        .add_row_field("Region")
        .add_value_field(&PivotTableValueField::new("Volume"))
        .add_filter_field("Month");

    // Add the pivot table to a new worksheet. The filter is displayed in the
    // first row and the pivot table body starts in the third row.
    let worksheet = workbook.add_worksheet().set_name("Pivot4")?;
    worksheet.add_pivot_table(0, 0, &pivot_table)?;

    // -----------------------------------------------------------------------
    // 5. Add a pivot table with two Row fields.
    // -----------------------------------------------------------------------

    // Create a pivot table based on the worksheet data and summarize the
    // "Volume" data by "Region" and then by "Item" within each region.
    let pivot_table = PivotTable::new()
        .set_data_source("Data!A1:D51")
        .add_row_field("Region")
        .add_row_field("Item")
        .add_value_field(&PivotTableValueField::new("Volume"));

    // Add the pivot table to a new worksheet.
    let worksheet = workbook.add_worksheet().set_name("Pivot5")?;
    worksheet.add_pivot_table(2, 0, &pivot_table)?;

    // -----------------------------------------------------------------------
    // 6. Add a pivot table with several Value fields.
    // -----------------------------------------------------------------------

    // Create a pivot table based on the worksheet data and summarize the
    // "Volume" data by "Region" using different functions.
    let pivot_table = PivotTable::new()
        .set_data_source("Data!A1:D51")
        .add_row_field("Region")
        .add_value_field(&PivotTableValueField::new("Volume"))
        .add_value_field(
            &PivotTableValueField::new("Volume").set_function(PivotTableFunction::Count),
        )
        .add_value_field(
            &PivotTableValueField::new("Volume").set_function(PivotTableFunction::Average),
        );

    // Add the pivot table to a new worksheet.
    let worksheet = workbook.add_worksheet().set_name("Pivot6")?;
    worksheet.add_pivot_table(2, 0, &pivot_table)?;

    // -----------------------------------------------------------------------
    // 7. Add a pivot table with a custom name and number format.
    // -----------------------------------------------------------------------

    // Create a pivot table based on the worksheet data and summarize the
    // "Volume" data by "Region", with a custom name and number format.
    let pivot_table = PivotTable::new()
        .set_data_source("Data!A1:D51")
        .add_row_field("Region")
        .add_value_field(
            &PivotTableValueField::new("Volume")
                .set_custom_name("Total Volume")
                .set_num_format("#,##0"),
        );

    // Add the pivot table to a new worksheet.
    let worksheet = workbook.add_worksheet().set_name("Pivot7")?;
    worksheet.add_pivot_table(2, 0, &pivot_table)?;

    // -----------------------------------------------------------------------
    // 8. Add a pivot table with a different style and no grand totals.
    // -----------------------------------------------------------------------

    // Create a pivot table based on the worksheet data and summarize the
    // "Volume" data by "Region" and "Item", without grand totals.
    let pivot_table = PivotTable::new()
        .set_data_source("Data!A1:D51")
        .add_row_field("Region")
        .add_column_field("Item")
        .add_value_field(&PivotTableValueField::new("Volume"))
        .set_style(PivotTableStyle::Medium9)
        .set_row_grand_totals(false)
        .set_column_grand_totals(false);

    // Add the pivot table to a new worksheet.
    let worksheet = workbook.add_worksheet().set_name("Pivot8")?;
    worksheet.add_pivot_table(2, 0, &pivot_table)?;

    // -----------------------------------------------------------------------
    // 9. Add a pivot table with a tabular layout.
    // -----------------------------------------------------------------------

    // Create a pivot table based on the worksheet data and summarize the
    // "Volume" data by "Region" and "Item", with each row field in its own
    // column.
    let pivot_table = PivotTable::new()
        .set_data_source("Data!A1:D51")
        .add_row_field("Region")
        .add_row_field("Item")
        .add_value_field(&PivotTableValueField::new("Volume"))
        .set_layout(PivotTableLayout::Tabular);

    // Add the pivot table to a new worksheet.
    let worksheet = workbook.add_worksheet().set_name("Pivot9")?;
    worksheet.add_pivot_table(2, 0, &pivot_table)?;

    // -----------------------------------------------------------------------
    // 10. Add two pivot tables to the same worksheet.
    // -----------------------------------------------------------------------

    // Create two pivot tables based on the worksheet data and summarize the
    // "Volume" data by "Region" in one and by "Item" in the other.
    let pivot_table1 = PivotTable::new()
        .set_data_source("Data!A1:D51")
        .add_row_field("Region")
        .add_value_field(&PivotTableValueField::new("Volume"));

    let pivot_table2 = PivotTable::new()
        .set_data_source("Data!A1:D51")
        .add_row_field("Item")
        .add_value_field(&PivotTableValueField::new("Volume"));

    // Add the pivot tables side by side on a new worksheet.
    let worksheet = workbook.add_worksheet().set_name("Pivot10")?;
    worksheet.add_pivot_table(2, 0, &pivot_table1)?;
    worksheet.add_pivot_table(2, 5, &pivot_table2)?;

    // -----------------------------------------------------------------------
    // 11. Add a pivot table to the same worksheet as the data.
    // -----------------------------------------------------------------------

    // Add a new worksheet with a copy of the sample data.
    let worksheet = workbook.add_worksheet().set_name("Pivot11")?;
    populate_pivot_data(worksheet)?;

    // Create a pivot table based on the data in the same worksheet and
    // summarize the "Volume" data by "Region".
    let pivot_table = PivotTable::new()
        .set_data_source("Pivot11!A1:D51")
        .add_row_field("Region")
        .add_value_field(&PivotTableValueField::new("Volume"));

    // Add the pivot table to the right of the data.
    worksheet.add_pivot_table(2, 6, &pivot_table)?;

    // Save the file to disk.
    workbook.save("pivot_table.xlsx")?;

    Ok(())
}

// Generate worksheet data for the pivot tables.
pub fn populate_pivot_data(worksheet: &mut Worksheet) -> Result<(), XlsxError> {
    // The sample data to add to the worksheet.
    let data = [
        ("East", "Apple", 9000, "July"),
        ("East", "Apple", 5000, "April"),
        ("South", "Orange", 9000, "September"),
        ("North", "Apple", 2000, "November"),
        ("West", "Apple", 9000, "November"),
        ("South", "Pear", 7000, "October"),
        ("North", "Pear", 9000, "August"),
        ("West", "Orange", 1000, "December"),
        ("West", "Grape", 1000, "November"),
        ("South", "Pear", 10000, "April"),
        ("West", "Grape", 6000, "January"),
        ("South", "Orange", 3000, "May"),
        ("North", "Apple", 3000, "December"),
        ("South", "Apple", 7000, "February"),
        ("West", "Grape", 1000, "December"),
        ("East", "Grape", 8000, "February"),
        ("South", "Grape", 10000, "June"),
        ("West", "Pear", 7000, "December"),
        ("South", "Apple", 2000, "October"),
        ("East", "Grape", 7000, "December"),
        ("North", "Grape", 6000, "July"),
        ("East", "Pear", 8000, "February"),
        ("North", "Apple", 7000, "August"),
        ("North", "Orange", 7000, "July"),
        ("North", "Apple", 6000, "June"),
        ("South", "Grape", 8000, "September"),
        ("West", "Apple", 3000, "October"),
        ("South", "Orange", 10000, "November"),
        ("West", "Grape", 4000, "December"),
        ("North", "Orange", 5000, "August"),
        ("East", "Orange", 1000, "November"),
        ("East", "Orange", 4000, "October"),
        ("North", "Grape", 5000, "August"),
        ("East", "Apple", 1000, "July"),
        ("South", "Apple", 10000, "March"),
        ("East", "Grape", 7000, "October"),
        ("West", "Grape", 1000, "September"),
        ("East", "Grape", 10000, "October"),
        ("South", "Orange", 8000, "March"),
        ("North", "Apple", 4000, "July"),
        ("South", "Orange", 5000, "July"),
        ("West", "Apple", 4000, "June"),
        ("East", "Apple", 5000, "April"),
        ("North", "Pear", 3000, "August"),
        ("East", "Grape", 9000, "November"),
        ("North", "Orange", 8000, "October"),
        ("East", "Apple", 10000, "June"),
        ("South", "Pear", 1000, "December"),
        ("North", "Grape", 10000, "July"),
        ("East", "Grape", 6000, "February"),
    ];

    // Widen the columns for clarity.
    worksheet.set_column_width(0, 12)?;
    worksheet.set_column_width(1, 12)?;
    worksheet.set_column_width(2, 12)?;
    worksheet.set_column_width(3, 12)?;

    // Write the header titles.
    let header_format = Format::new().set_bold();
    worksheet.write_string_with_format(0, 0, "Region", &header_format)?;
    worksheet.write_string_with_format(0, 1, "Item", &header_format)?;
    worksheet.write_string_with_format(0, 2, "Volume", &header_format)?;
    worksheet.write_string_with_format(0, 3, "Month", &header_format)?;

    // Write the other worksheet data.
    for (row, data) in data.iter().enumerate() {
        let row = 1 + row as u32;
        worksheet.write_string(row, 0, data.0)?;
        worksheet.write_string(row, 1, data.1)?;
        worksheet.write_number(row, 2, data.2)?;
        worksheet.write_string(row, 3, data.3)?;
    }

    Ok(())
}
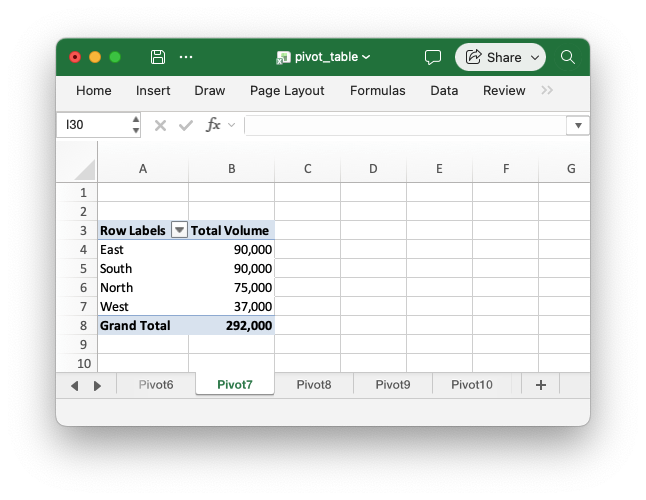
Example 7. Pivot table with a custom name and number format for the value field.
Code to generate the above example:
// SPDX-License-Identifier: MIT OR Apache-2.0
//
// Copyright 2022-2026, John McNamara, jmcnamara@cpan.org

//! An example of how to create pivot tables with the `rust_xlsxwriter` library.
//!
//! A pivot table is a way of grouping and summarizing the data in a worksheet
//! range.
//!

use rust_xlsxwriter::{
    Format, PivotTable, PivotTableFunction, PivotTableLayout, PivotTableStyle,
    PivotTableValueField, Workbook, Worksheet, XlsxError,
};

fn main() -> Result<(), XlsxError> {
    // Create a new Excel file object.
    let mut workbook = Workbook::new();

    // Add a worksheet with some sample data for the pivot tables.
    let worksheet = workbook.add_worksheet().set_name("Data")?;
    populate_pivot_data(worksheet)?;

    // -----------------------------------------------------------------------
    // 1. Add an empty pivot table.
    // -----------------------------------------------------------------------

    // Create a pivot table based on the worksheet data.
    let pivot_table = PivotTable::new().set_data_source("Data!A1:D51");

    // Add the pivot table to a new worksheet.
    let worksheet = workbook.add_worksheet().set_name("Pivot1")?;
    worksheet.add_pivot_table(2, 0, &pivot_table)?;

    // -----------------------------------------------------------------------
    // 2. Add a pivot table with a Row field and a Value field.
    // -----------------------------------------------------------------------

    // Create a pivot table based on the worksheet data and summarize the
    // "Volume" data by "Region". Note that the data source can also be
    // specified as a tuple.
    let pivot_table = PivotTable::new()
        .set_data_source(("Data", 0, 0, 50, 3))
        .add_row_field("Region")
        .add_value_field(&PivotTableValueField::new("Volume"));

    // Add the pivot table to a new worksheet.
    let worksheet = workbook.add_worksheet().set_name("Pivot2")?;
    worksheet.add_pivot_table(2, 0, &pivot_table)?;

    // -----------------------------------------------------------------------
    // 3. Add a pivot table with a Row field, a Column field and a Value field.
    // -----------------------------------------------------------------------

    // Create a pivot table based on the worksheet data and summarize the
    // "Volume" data by "Region" and "Item".
    let pivot_table = PivotTable::new()
        .set_data_source("Data!A1:D51")
        .add_row_field("Region")
        .add_column_field("Item")
        .add_value_field(&PivotTableValueField::new("Volume"));

    // Add the pivot table to a new worksheet.
    let worksheet = workbook.add_worksheet().set_name("Pivot3")?;
    worksheet.add_pivot_table(2, 0, &pivot_table)?;

    // -----------------------------------------------------------------------
    // 4. Add a pivot table with a Filter field.
    // -----------------------------------------------------------------------

    // Create a pivot table based on the worksheet data and summarize the
    // "Volume" data by "Region", with a filter on "Month".
    let pivot_table = PivotTable::new()
        .set_data_source("Data!A1:D51")
        .add_row_field("Region")
        .add_value_field(&PivotTableValueField::new("Volume"))
        .add_filter_field("Month");

    // Add the pivot table to a new worksheet. The filter is displayed in the
    // first row and the pivot table body starts in the third row.
    let worksheet = workbook.add_worksheet().set_name("Pivot4")?;
    worksheet.add_pivot_table(0, 0, &pivot_table)?;

    // -----------------------------------------------------------------------
    // 5. Add a pivot table with two Row fields.
    // -----------------------------------------------------------------------

    // Create a pivot table based on the worksheet data and summarize the
    // "Volume" data by "Region" and then by "Item" within each region.
    let pivot_table = PivotTable::new()
        .set_data_source("Data!A1:D51")
        .add_row_field("Region")
        .add_row_field("Item")
        .add_value_field(&PivotTableValueField::new("Volume"));

    // Add the pivot table to a new worksheet.
    let worksheet = workbook.add_worksheet().set_name("Pivot5")?;
    worksheet.add_pivot_table(2, 0, &pivot_table)?;

    // -----------------------------------------------------------------------
    // 6. Add a pivot table with several Value fields.
    // -----------------------------------------------------------------------

    // Create a pivot table based on the worksheet data and summarize the
    // "Volume" data by "Region" using different functions.
    let pivot_table = PivotTable::new()
        .set_data_source("Data!A1:D51")
        .add_row_field("Region")
        .add_value_field(&PivotTableValueField::new("Volume"))
        .add_value_field(
            &PivotTableValueField::new("Volume").set_function(PivotTableFunction::Count),
        )
        .add_value_field(
            &PivotTableValueField::new("Volume").set_function(PivotTableFunction::Average),
        );

    // Add the pivot table to a new worksheet.
    let worksheet = workbook.add_worksheet().set_name("Pivot6")?;
    worksheet.add_pivot_table(2, 0, &pivot_table)?;

    // -----------------------------------------------------------------------
    // 7. Add a pivot table with a custom name and number format.
    // -----------------------------------------------------------------------

    // Create a pivot table based on the worksheet data and summarize the
    // "Volume" data by "Region", with a custom name and number format.
    let pivot_table = PivotTable::new()
        .set_data_source("Data!A1:D51")
        .add_row_field("Region")
        .add_value_field(
            &PivotTableValueField::new("Volume")
                .set_custom_name("Total Volume")
                .set_num_format("#,##0"),
        );

    // Add the pivot table to a new worksheet.
    let worksheet = workbook.add_worksheet().set_name("Pivot7")?;
    worksheet.add_pivot_table(2, 0, &pivot_table)?;

    // -----------------------------------------------------------------------
    // 8. Add a pivot table with a different style and no grand totals.
    // -----------------------------------------------------------------------

    // Create a pivot table based on the worksheet data and summarize the
    // "Volume" data by "Region" and "Item", without grand totals.
    let pivot_table = PivotTable::new()
        .set_data_source("Data!A1:D51")
        .add_row_field("Region")
        .add_column_field("Item")
        .add_value_field(&PivotTableValueField::new("Volume"))
        .set_style(PivotTableStyle::Medium9)
        .set_row_grand_totals(false)
        .set_column_grand_totals(false);

    // Add the pivot table to a new worksheet.
    let worksheet = workbook.add_worksheet().set_name("Pivot8")?;
    worksheet.add_pivot_table(2, 0, &pivot_table)?;

    // -----------------------------------------------------------------------
    // 9. Add a pivot table with a tabular layout.
    // -----------------------------------------------------------------------

    // Create a pivot table based on the worksheet data and summarize the
    // "Volume" data by "Region" and "Item", with each row field in its own
    // column.
    let pivot_table = PivotTable::new()
        .set_data_source("Data!A1:D51")
        .add_row_field("Region")
        .add_row_field("Item")
        .add_value_field(&PivotTableValueField::new("Volume"))
        .set_layout(PivotTableLayout::Tabular);

    // Add the pivot table to a new worksheet.
    let worksheet = workbook.add_worksheet().set_name("Pivot9")?;
    worksheet.add_pivot_table(2, 0, &pivot_table)?;

    // -----------------------------------------------------------------------
    // 10. Add two pivot tables to the same worksheet.
    // -----------------------------------------------------------------------

    // Create two pivot tables based on the worksheet data and summarize the
    // "Volume" data by "Region" in one and by "Item" in the other.
    let pivot_table1 = PivotTable::new()
        .set_data_source("Data!A1:D51")
        .add_row_field("Region")
        .add_value_field(&PivotTableValueField::new("Volume"));

    let pivot_table2 = PivotTable::new()
        .set_data_source("Data!A1:D51")
        .add_row_field("Item")
        .add_value_field(&PivotTableValueField::new("Volume"));

    // Add the pivot tables side by side on a new worksheet.
    let worksheet = workbook.add_worksheet().set_name("Pivot10")?;
    worksheet.add_pivot_table(2, 0, &pivot_table1)?;
    worksheet.add_pivot_table(2, 5, &pivot_table2)?;

    // -----------------------------------------------------------------------
    // 11. Add a pivot table to the same worksheet as the data.
    // -----------------------------------------------------------------------

    // Add a new worksheet with a copy of the sample data.
    let worksheet = workbook.add_worksheet().set_name("Pivot11")?;
    populate_pivot_data(worksheet)?;

    // Create a pivot table based on the data in the same worksheet and
    // summarize the "Volume" data by "Region".
    let pivot_table = PivotTable::new()
        .set_data_source("Pivot11!A1:D51")
        .add_row_field("Region")
        .add_value_field(&PivotTableValueField::new("Volume"));

    // Add the pivot table to the right of the data.
    worksheet.add_pivot_table(2, 6, &pivot_table)?;

    // Save the file to disk.
    workbook.save("pivot_table.xlsx")?;

    Ok(())
}

// Generate worksheet data for the pivot tables.
pub fn populate_pivot_data(worksheet: &mut Worksheet) -> Result<(), XlsxError> {
    // The sample data to add to the worksheet.
    let data = [
        ("East", "Apple", 9000, "July"),
        ("East", "Apple", 5000, "April"),
        ("South", "Orange", 9000, "September"),
        ("North", "Apple", 2000, "November"),
        ("West", "Apple", 9000, "November"),
        ("South", "Pear", 7000, "October"),
        ("North", "Pear", 9000, "August"),
        ("West", "Orange", 1000, "December"),
        ("West", "Grape", 1000, "November"),
        ("South", "Pear", 10000, "April"),
        ("West", "Grape", 6000, "January"),
        ("South", "Orange", 3000, "May"),
        ("North", "Apple", 3000, "December"),
        ("South", "Apple", 7000, "February"),
        ("West", "Grape", 1000, "December"),
        ("East", "Grape", 8000, "February"),
        ("South", "Grape", 10000, "June"),
        ("West", "Pear", 7000, "December"),
        ("South", "Apple", 2000, "October"),
        ("East", "Grape", 7000, "December"),
        ("North", "Grape", 6000, "July"),
        ("East", "Pear", 8000, "February"),
        ("North", "Apple", 7000, "August"),
        ("North", "Orange", 7000, "July"),
        ("North", "Apple", 6000, "June"),
        ("South", "Grape", 8000, "September"),
        ("West", "Apple", 3000, "October"),
        ("South", "Orange", 10000, "November"),
        ("West", "Grape", 4000, "December"),
        ("North", "Orange", 5000, "August"),
        ("East", "Orange", 1000, "November"),
        ("East", "Orange", 4000, "October"),
        ("North", "Grape", 5000, "August"),
        ("East", "Apple", 1000, "July"),
        ("South", "Apple", 10000, "March"),
        ("East", "Grape", 7000, "October"),
        ("West", "Grape", 1000, "September"),
        ("East", "Grape", 10000, "October"),
        ("South", "Orange", 8000, "March"),
        ("North", "Apple", 4000, "July"),
        ("South", "Orange", 5000, "July"),
        ("West", "Apple", 4000, "June"),
        ("East", "Apple", 5000, "April"),
        ("North", "Pear", 3000, "August"),
        ("East", "Grape", 9000, "November"),
        ("North", "Orange", 8000, "October"),
        ("East", "Apple", 10000, "June"),
        ("South", "Pear", 1000, "December"),
        ("North", "Grape", 10000, "July"),
        ("East", "Grape", 6000, "February"),
    ];

    // Widen the columns for clarity.
    worksheet.set_column_width(0, 12)?;
    worksheet.set_column_width(1, 12)?;
    worksheet.set_column_width(2, 12)?;
    worksheet.set_column_width(3, 12)?;

    // Write the header titles.
    let header_format = Format::new().set_bold();
    worksheet.write_string_with_format(0, 0, "Region", &header_format)?;
    worksheet.write_string_with_format(0, 1, "Item", &header_format)?;
    worksheet.write_string_with_format(0, 2, "Volume", &header_format)?;
    worksheet.write_string_with_format(0, 3, "Month", &header_format)?;

    // Write the other worksheet data.
    for (row, data) in data.iter().enumerate() {
        let row = 1 + row as u32;
        worksheet.write_string(row, 0, data.0)?;
        worksheet.write_string(row, 1, data.1)?;
        worksheet.write_number(row, 2, data.2)?;
        worksheet.write_string(row, 3, data.3)?;
    }

    Ok(())
}
Example 8. Pivot table with a different style and no grand totals.
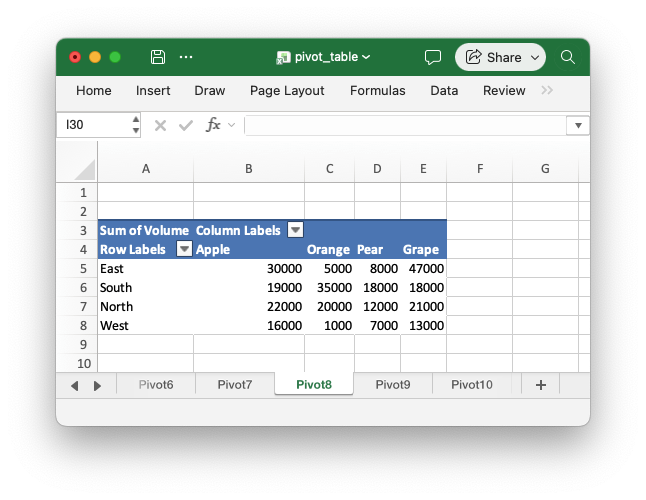
Code to generate the above example:
// SPDX-License-Identifier: MIT OR Apache-2.0
//
// Copyright 2022-2026, John McNamara, jmcnamara@cpan.org

//! An example of how to create pivot tables with the `rust_xlsxwriter` library.
//!
//! A pivot table is a way of grouping and summarizing the data in a worksheet
//! range.
//!

use rust_xlsxwriter::{
    Format, PivotTable, PivotTableFunction, PivotTableLayout, PivotTableStyle,
    PivotTableValueField, Workbook, Worksheet, XlsxError,
};

fn main() -> Result<(), XlsxError> {
    // Create a new Excel file object.
    let mut workbook = Workbook::new();

    // Add a worksheet with some sample data for the pivot tables.
    let worksheet = workbook.add_worksheet().set_name("Data")?;
    populate_pivot_data(worksheet)?;

    // -----------------------------------------------------------------------
    // 1. Add an empty pivot table.
    // -----------------------------------------------------------------------

    // Create a pivot table based on the worksheet data.
    let pivot_table = PivotTable::new().set_data_source("Data!A1:D51");

    // Add the pivot table to a new worksheet.
    let worksheet = workbook.add_worksheet().set_name("Pivot1")?;
    worksheet.add_pivot_table(2, 0, &pivot_table)?;

    // -----------------------------------------------------------------------
    // 2. Add a pivot table with a Row field and a Value field.
    // -----------------------------------------------------------------------

    // Create a pivot table based on the worksheet data and summarize the
    // "Volume" data by "Region". Note that the data source can also be
    // specified as a tuple.
    let pivot_table = PivotTable::new()
        .set_data_source(("Data", 0, 0, 50, 3))
        .add_row_field("Region")
        .add_value_field(&PivotTableValueField::new("Volume"));

    // Add the pivot table to a new worksheet.
    let worksheet = workbook.add_worksheet().set_name("Pivot2")?;
    worksheet.add_pivot_table(2, 0, &pivot_table)?;

    // -----------------------------------------------------------------------
    // 3. Add a pivot table with a Row field, a Column field and a Value field.
    // -----------------------------------------------------------------------

    // Create a pivot table based on the worksheet data and summarize the
    // "Volume" data by "Region" and "Item".
    let pivot_table = PivotTable::new()
        .set_data_source("Data!A1:D51")
        .add_row_field("Region")
        .add_column_field("Item")
        .add_value_field(&PivotTableValueField::new("Volume"));

    // Add the pivot table to a new worksheet.
    let worksheet = workbook.add_worksheet().set_name("Pivot3")?;
    worksheet.add_pivot_table(2, 0, &pivot_table)?;

    // -----------------------------------------------------------------------
    // 4. Add a pivot table with a Filter field.
    // -----------------------------------------------------------------------

    // Create a pivot table based on the worksheet data and summarize the
    // "Volume" data by "Region", with a filter on "Month".
    let pivot_table = PivotTable::new()
        .set_data_source("Data!A1:D51")
        .add_row_field("Region")
        .add_value_field(&PivotTableValueField::new("Volume"))
        .add_filter_field("Month");

    // Add the pivot table to a new worksheet. The filter is displayed in the
    // first row and the pivot table body starts in the third row.
    let worksheet = workbook.add_worksheet().set_name("Pivot4")?;
    worksheet.add_pivot_table(0, 0, &pivot_table)?;

    // -----------------------------------------------------------------------
    // 5. Add a pivot table with two Row fields.
    // -----------------------------------------------------------------------

    // Create a pivot table based on the worksheet data and summarize the
    // "Volume" data by "Region" and then by "Item" within each region.
    let pivot_table = PivotTable::new()
        .set_data_source("Data!A1:D51")
        .add_row_field("Region")
        .add_row_field("Item")
        .add_value_field(&PivotTableValueField::new("Volume"));

    // Add the pivot table to a new worksheet.
    let worksheet = workbook.add_worksheet().set_name("Pivot5")?;
    worksheet.add_pivot_table(2, 0, &pivot_table)?;

    // -----------------------------------------------------------------------
    // 6. Add a pivot table with several Value fields.
    // -----------------------------------------------------------------------

    // Create a pivot table based on the worksheet data and summarize the
    // "Volume" data by "Region" using different functions.
    let pivot_table = PivotTable::new()
        .set_data_source("Data!A1:D51")
        .add_row_field("Region")
        .add_value_field(&PivotTableValueField::new("Volume"))
        .add_value_field(
            &PivotTableValueField::new("Volume").set_function(PivotTableFunction::Count),
        )
        .add_value_field(
            &PivotTableValueField::new("Volume").set_function(PivotTableFunction::Average),
        );

    // Add the pivot table to a new worksheet.
    let worksheet = workbook.add_worksheet().set_name("Pivot6")?;
    worksheet.add_pivot_table(2, 0, &pivot_table)?;

    // -----------------------------------------------------------------------
    // 7. Add a pivot table with a custom name and number format.
    // -----------------------------------------------------------------------

    // Create a pivot table based on the worksheet data and summarize the
    // "Volume" data by "Region", with a custom name and number format.
    let pivot_table = PivotTable::new()
        .set_data_source("Data!A1:D51")
        .add_row_field("Region")
        .add_value_field(
            &PivotTableValueField::new("Volume")
                .set_custom_name("Total Volume")
                .set_num_format("#,##0"),
        );

    // Add the pivot table to a new worksheet.
    let worksheet = workbook.add_worksheet().set_name("Pivot7")?;
    worksheet.add_pivot_table(2, 0, &pivot_table)?;

    // -----------------------------------------------------------------------
    // 8. Add a pivot table with a different style and no grand totals.
    // -----------------------------------------------------------------------

    // Create a pivot table based on the worksheet data and summarize the
    // "Volume" data by "Region" and "Item", without grand totals.
    let pivot_table = PivotTable::new()
        .set_data_source("Data!A1:D51")
        .add_row_field("Region")
        .add_column_field("Item")
        .add_value_field(&PivotTableValueField::new("Volume"))
        .set_style(PivotTableStyle::Medium9)
        .set_row_grand_totals(false)
        .set_column_grand_totals(false);

    // Add the pivot table to a new worksheet.
    let worksheet = workbook.add_worksheet().set_name("Pivot8")?;
    worksheet.add_pivot_table(2, 0, &pivot_table)?;

    // -----------------------------------------------------------------------
    // 9. Add a pivot table with a tabular layout.
    // -----------------------------------------------------------------------

    // Create a pivot table based on the worksheet data and summarize the
    // "Volume" data by "Region" and "Item", with each row field in its own
    // column.
    let pivot_table = PivotTable::new()
        .set_data_source("Data!A1:D51")
        .add_row_field("Region")
        .add_row_field("Item")
        .add_value_field(&PivotTableValueField::new("Volume"))
        .set_layout(PivotTableLayout::Tabular);

    // Add the pivot table to a new worksheet.
    let worksheet = workbook.add_worksheet().set_name("Pivot9")?;
    worksheet.add_pivot_table(2, 0, &pivot_table)?;

    // -----------------------------------------------------------------------
    // 10. Add two pivot tables to the same worksheet.
    // -----------------------------------------------------------------------

    // Create two pivot tables based on the worksheet data and summarize the
    // "Volume" data by "Region" in one and by "Item" in the other.
    let pivot_table1 = PivotTable::new()
        .set_data_source("Data!A1:D51")
        .add_row_field("Region")
        .add_value_field(&PivotTableValueField::new("Volume"));

    let pivot_table2 = PivotTable::new()
        .set_data_source("Data!A1:D51")
        .add_row_field("Item")
        .add_value_field(&PivotTableValueField::new("Volume"));

    // Add the pivot tables side by side on a new worksheet.
    let worksheet = workbook.add_worksheet().set_name("Pivot10")?;
    worksheet.add_pivot_table(2, 0, &pivot_table1)?;
    worksheet.add_pivot_table(2, 5, &pivot_table2)?;

    // -----------------------------------------------------------------------
    // 11. Add a pivot table to the same worksheet as the data.
    // -----------------------------------------------------------------------

    // Add a new worksheet with a copy of the sample data.
    let worksheet = workbook.add_worksheet().set_name("Pivot11")?;
    populate_pivot_data(worksheet)?;

    // Create a pivot table based on the data in the same worksheet and
    // summarize the "Volume" data by "Region".
    let pivot_table = PivotTable::new()
        .set_data_source("Pivot11!A1:D51")
        .add_row_field("Region")
        .add_value_field(&PivotTableValueField::new("Volume"));

    // Add the pivot table to the right of the data.
    worksheet.add_pivot_table(2, 6, &pivot_table)?;

    // Save the file to disk.
    workbook.save("pivot_table.xlsx")?;

    Ok(())
}

// Generate worksheet data for the pivot tables.
pub fn populate_pivot_data(worksheet: &mut Worksheet) -> Result<(), XlsxError> {
    // The sample data to add to the worksheet.
    let data = [
        ("East", "Apple", 9000, "July"),
        ("East", "Apple", 5000, "April"),
        ("South", "Orange", 9000, "September"),
        ("North", "Apple", 2000, "November"),
        ("West", "Apple", 9000, "November"),
        ("South", "Pear", 7000, "October"),
        ("North", "Pear", 9000, "August"),
        ("West", "Orange", 1000, "December"),
        ("West", "Grape", 1000, "November"),
        ("South", "Pear", 10000, "April"),
        ("West", "Grape", 6000, "January"),
        ("South", "Orange", 3000, "May"),
        ("North", "Apple", 3000, "December"),
        ("South", "Apple", 7000, "February"),
        ("West", "Grape", 1000, "December"),
        ("East", "Grape", 8000, "February"),
        ("South", "Grape", 10000, "June"),
        ("West", "Pear", 7000, "December"),
        ("South", "Apple", 2000, "October"),
        ("East", "Grape", 7000, "December"),
        ("North", "Grape", 6000, "July"),
        ("East", "Pear", 8000, "February"),
        ("North", "Apple", 7000, "August"),
        ("North", "Orange", 7000, "July"),
        ("North", "Apple", 6000, "June"),
        ("South", "Grape", 8000, "September"),
        ("West", "Apple", 3000, "October"),
        ("South", "Orange", 10000, "November"),
        ("West", "Grape", 4000, "December"),
        ("North", "Orange", 5000, "August"),
        ("East", "Orange", 1000, "November"),
        ("East", "Orange", 4000, "October"),
        ("North", "Grape", 5000, "August"),
        ("East", "Apple", 1000, "July"),
        ("South", "Apple", 10000, "March"),
        ("East", "Grape", 7000, "October"),
        ("West", "Grape", 1000, "September"),
        ("East", "Grape", 10000, "October"),
        ("South", "Orange", 8000, "March"),
        ("North", "Apple", 4000, "July"),
        ("South", "Orange", 5000, "July"),
        ("West", "Apple", 4000, "June"),
        ("East", "Apple", 5000, "April"),
        ("North", "Pear", 3000, "August"),
        ("East", "Grape", 9000, "November"),
        ("North", "Orange", 8000, "October"),
        ("East", "Apple", 10000, "June"),
        ("South", "Pear", 1000, "December"),
        ("North", "Grape", 10000, "July"),
        ("East", "Grape", 6000, "February"),
    ];

    // Widen the columns for clarity.
    worksheet.set_column_width(0, 12)?;
    worksheet.set_column_width(1, 12)?;
    worksheet.set_column_width(2, 12)?;
    worksheet.set_column_width(3, 12)?;

    // Write the header titles.
    let header_format = Format::new().set_bold();
    worksheet.write_string_with_format(0, 0, "Region", &header_format)?;
    worksheet.write_string_with_format(0, 1, "Item", &header_format)?;
    worksheet.write_string_with_format(0, 2, "Volume", &header_format)?;
    worksheet.write_string_with_format(0, 3, "Month", &header_format)?;

    // Write the other worksheet data.
    for (row, data) in data.iter().enumerate() {
        let row = 1 + row as u32;
        worksheet.write_string(row, 0, data.0)?;
        worksheet.write_string(row, 1, data.1)?;
        worksheet.write_number(row, 2, data.2)?;
        worksheet.write_string(row, 3, data.3)?;
    }

    Ok(())
}
Example 9. Pivot table with a tabular layout.
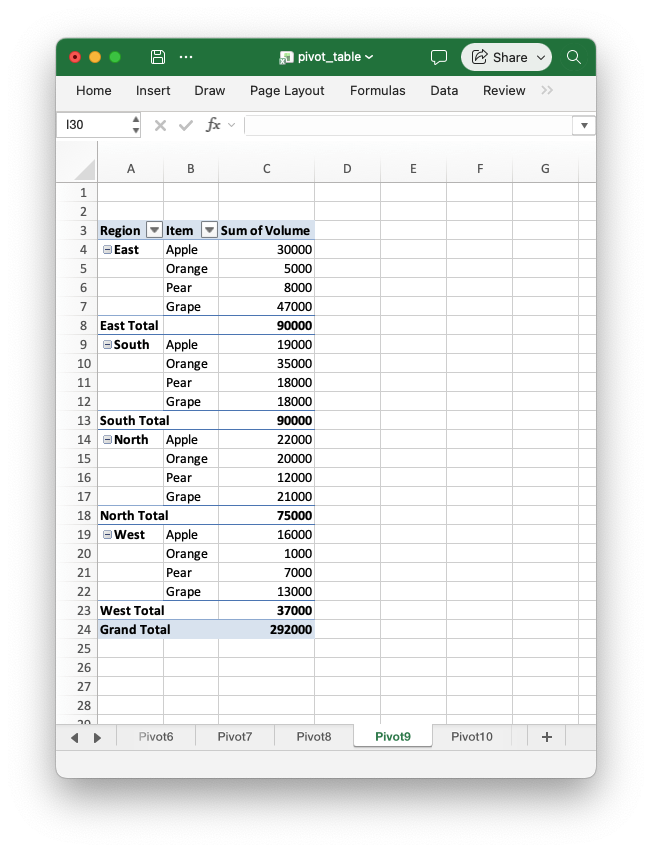
Code to generate the above example:
// SPDX-License-Identifier: MIT OR Apache-2.0
//
// Copyright 2022-2026, John McNamara, jmcnamara@cpan.org

//! An example of how to create pivot tables with the `rust_xlsxwriter` library.
//!
//! A pivot table is a way of grouping and summarizing the data in a worksheet
//! range.
//!

use rust_xlsxwriter::{
    Format, PivotTable, PivotTableFunction, PivotTableLayout, PivotTableStyle,
    PivotTableValueField, Workbook, Worksheet, XlsxError,
};

fn main() -> Result<(), XlsxError> {
    // Create a new Excel file object.
    let mut workbook = Workbook::new();

    // Add a worksheet with some sample data for the pivot tables.
    let worksheet = workbook.add_worksheet().set_name("Data")?;
    populate_pivot_data(worksheet)?;

    // -----------------------------------------------------------------------
    // 1. Add an empty pivot table.
    // -----------------------------------------------------------------------

    // Create a pivot table based on the worksheet data.
    let pivot_table = PivotTable::new().set_data_source("Data!A1:D51");

    // Add the pivot table to a new worksheet.
    let worksheet = workbook.add_worksheet().set_name("Pivot1")?;
    worksheet.add_pivot_table(2, 0, &pivot_table)?;

    // -----------------------------------------------------------------------
    // 2. Add a pivot table with a Row field and a Value field.
    // -----------------------------------------------------------------------

    // Create a pivot table based on the worksheet data and summarize the
    // "Volume" data by "Region". Note that the data source can also be
    // specified as a tuple.
    let pivot_table = PivotTable::new()
        .set_data_source(("Data", 0, 0, 50, 3))
        .add_row_field("Region")
        .add_value_field(&PivotTableValueField::new("Volume"));

    // Add the pivot table to a new worksheet.
    let worksheet = workbook.add_worksheet().set_name("Pivot2")?;
    worksheet.add_pivot_table(2, 0, &pivot_table)?;

    // -----------------------------------------------------------------------
    // 3. Add a pivot table with a Row field, a Column field and a Value field.
    // -----------------------------------------------------------------------

    // Create a pivot table based on the worksheet data and summarize the
    // "Volume" data by "Region" and "Item".
    let pivot_table = PivotTable::new()
        .set_data_source("Data!A1:D51")
        .add_row_field("Region")
        .add_column_field("Item")
        .add_value_field(&PivotTableValueField::new("Volume"));

    // Add the pivot table to a new worksheet.
    let worksheet = workbook.add_worksheet().set_name("Pivot3")?;
    worksheet.add_pivot_table(2, 0, &pivot_table)?;

    // -----------------------------------------------------------------------
    // 4. Add a pivot table with a Filter field.
    // -----------------------------------------------------------------------

    // Create a pivot table based on the worksheet data and summarize the
    // "Volume" data by "Region", with a filter on "Month".
    let pivot_table = PivotTable::new()
        .set_data_source("Data!A1:D51")
        .add_row_field("Region")
        .add_value_field(&PivotTableValueField::new("Volume"))
        .add_filter_field("Month");

    // Add the pivot table to a new worksheet. The filter is displayed in the
    // first row and the pivot table body starts in the third row.
    let worksheet = workbook.add_worksheet().set_name("Pivot4")?;
    worksheet.add_pivot_table(0, 0, &pivot_table)?;

    // -----------------------------------------------------------------------
    // 5. Add a pivot table with two Row fields.
    // -----------------------------------------------------------------------

    // Create a pivot table based on the worksheet data and summarize the
    // "Volume" data by "Region" and then by "Item" within each region.
    let pivot_table = PivotTable::new()
        .set_data_source("Data!A1:D51")
        .add_row_field("Region")
        .add_row_field("Item")
        .add_value_field(&PivotTableValueField::new("Volume"));

    // Add the pivot table to a new worksheet.
    let worksheet = workbook.add_worksheet().set_name("Pivot5")?;
    worksheet.add_pivot_table(2, 0, &pivot_table)?;

    // -----------------------------------------------------------------------
    // 6. Add a pivot table with several Value fields.
    // -----------------------------------------------------------------------

    // Create a pivot table based on the worksheet data and summarize the
    // "Volume" data by "Region" using different functions.
    let pivot_table = PivotTable::new()
        .set_data_source("Data!A1:D51")
        .add_row_field("Region")
        .add_value_field(&PivotTableValueField::new("Volume"))
        .add_value_field(
            &PivotTableValueField::new("Volume").set_function(PivotTableFunction::Count),
        )
        .add_value_field(
            &PivotTableValueField::new("Volume").set_function(PivotTableFunction::Average),
        );

    // Add the pivot table to a new worksheet.
    let worksheet = workbook.add_worksheet().set_name("Pivot6")?;
    worksheet.add_pivot_table(2, 0, &pivot_table)?;

    // -----------------------------------------------------------------------
    // 7. Add a pivot table with a custom name and number format.
    // -----------------------------------------------------------------------

    // Create a pivot table based on the worksheet data and summarize the
    // "Volume" data by "Region", with a custom name and number format.
    let pivot_table = PivotTable::new()
        .set_data_source("Data!A1:D51")
        .add_row_field("Region")
        .add_value_field(
            &PivotTableValueField::new("Volume")
                .set_custom_name("Total Volume")
                .set_num_format("#,##0"),
        );

    // Add the pivot table to a new worksheet.
    let worksheet = workbook.add_worksheet().set_name("Pivot7")?;
    worksheet.add_pivot_table(2, 0, &pivot_table)?;

    // -----------------------------------------------------------------------
    // 8. Add a pivot table with a different style and no grand totals.
    // -----------------------------------------------------------------------

    // Create a pivot table based on the worksheet data and summarize the
    // "Volume" data by "Region" and "Item", without grand totals.
    let pivot_table = PivotTable::new()
        .set_data_source("Data!A1:D51")
        .add_row_field("Region")
        .add_column_field("Item")
        .add_value_field(&PivotTableValueField::new("Volume"))
        .set_style(PivotTableStyle::Medium9)
        .set_row_grand_totals(false)
        .set_column_grand_totals(false);

    // Add the pivot table to a new worksheet.
    let worksheet = workbook.add_worksheet().set_name("Pivot8")?;
    worksheet.add_pivot_table(2, 0, &pivot_table)?;

    // -----------------------------------------------------------------------
    // 9. Add a pivot table with a tabular layout.
    // -----------------------------------------------------------------------

    // Create a pivot table based on the worksheet data and summarize the
    // "Volume" data by "Region" and "Item", with each row field in its own
    // column.
    let pivot_table = PivotTable::new()
        .set_data_source("Data!A1:D51")
        .add_row_field("Region")
        .add_row_field("Item")
        .add_value_field(&PivotTableValueField::new("Volume"))
        .set_layout(PivotTableLayout::Tabular);

    // Add the pivot table to a new worksheet.
    let worksheet = workbook.add_worksheet().set_name("Pivot9")?;
    worksheet.add_pivot_table(2, 0, &pivot_table)?;

    // -----------------------------------------------------------------------
    // 10. Add two pivot tables to the same worksheet.
    // -----------------------------------------------------------------------

    // Create two pivot tables based on the worksheet data and summarize the
    // "Volume" data by "Region" in one and by "Item" in the other.
    let pivot_table1 = PivotTable::new()
        .set_data_source("Data!A1:D51")
        .add_row_field("Region")
        .add_value_field(&PivotTableValueField::new("Volume"));

    let pivot_table2 = PivotTable::new()
        .set_data_source("Data!A1:D51")
        .add_row_field("Item")
        .add_value_field(&PivotTableValueField::new("Volume"));

    // Add the pivot tables side by side on a new worksheet.
    let worksheet = workbook.add_worksheet().set_name("Pivot10")?;
    worksheet.add_pivot_table(2, 0, &pivot_table1)?;
    worksheet.add_pivot_table(2, 5, &pivot_table2)?;

    // -----------------------------------------------------------------------
    // 11. Add a pivot table to the same worksheet as the data.
    // -----------------------------------------------------------------------

    // Add a new worksheet with a copy of the sample data.
    let worksheet = workbook.add_worksheet().set_name("Pivot11")?;
    populate_pivot_data(worksheet)?;

    // Create a pivot table based on the data in the same worksheet and
    // summarize the "Volume" data by "Region".
    let pivot_table = PivotTable::new()
        .set_data_source("Pivot11!A1:D51")
        .add_row_field("Region")
        .add_value_field(&PivotTableValueField::new("Volume"));

    // Add the pivot table to the right of the data.
    worksheet.add_pivot_table(2, 6, &pivot_table)?;

    // Save the file to disk.
    workbook.save("pivot_table.xlsx")?;

    Ok(())
}

// Generate worksheet data for the pivot tables.
pub fn populate_pivot_data(worksheet: &mut Worksheet) -> Result<(), XlsxError> {
    // The sample data to add to the worksheet.
    let data = [
        ("East", "Apple", 9000, "July"),
        ("East", "Apple", 5000, "April"),
        ("South", "Orange", 9000, "September"),
        ("North", "Apple", 2000, "November"),
        ("West", "Apple", 9000, "November"),
        ("South", "Pear", 7000, "October"),
        ("North", "Pear", 9000, "August"),
        ("West", "Orange", 1000, "December"),
        ("West", "Grape", 1000, "November"),
        ("South", "Pear", 10000, "April"),
        ("West", "Grape", 6000, "January"),
        ("South", "Orange", 3000, "May"),
        ("North", "Apple", 3000, "December"),
        ("South", "Apple", 7000, "February"),
        ("West", "Grape", 1000, "December"),
        ("East", "Grape", 8000, "February"),
        ("South", "Grape", 10000, "June"),
        ("West", "Pear", 7000, "December"),
        ("South", "Apple", 2000, "October"),
        ("East", "Grape", 7000, "December"),
        ("North", "Grape", 6000, "July"),
        ("East", "Pear", 8000, "February"),
        ("North", "Apple", 7000, "August"),
        ("North", "Orange", 7000, "July"),
        ("North", "Apple", 6000, "June"),
        ("South", "Grape", 8000, "September"),
        ("West", "Apple", 3000, "October"),
        ("South", "Orange", 10000, "November"),
        ("West", "Grape", 4000, "December"),
        ("North", "Orange", 5000, "August"),
        ("East", "Orange", 1000, "November"),
        ("East", "Orange", 4000, "October"),
        ("North", "Grape", 5000, "August"),
        ("East", "Apple", 1000, "July"),
        ("South", "Apple", 10000, "March"),
        ("East", "Grape", 7000, "October"),
        ("West", "Grape", 1000, "September"),
        ("East", "Grape", 10000, "October"),
        ("South", "Orange", 8000, "March"),
        ("North", "Apple", 4000, "July"),
        ("South", "Orange", 5000, "July"),
        ("West", "Apple", 4000, "June"),
        ("East", "Apple", 5000, "April"),
        ("North", "Pear", 3000, "August"),
        ("East", "Grape", 9000, "November"),
        ("North", "Orange", 8000, "October"),
        ("East", "Apple", 10000, "June"),
        ("South", "Pear", 1000, "December"),
        ("North", "Grape", 10000, "July"),
        ("East", "Grape", 6000, "February"),
    ];

    // Widen the columns for clarity.
    worksheet.set_column_width(0, 12)?;
    worksheet.set_column_width(1, 12)?;
    worksheet.set_column_width(2, 12)?;
    worksheet.set_column_width(3, 12)?;

    // Write the header titles.
    let header_format = Format::new().set_bold();
    worksheet.write_string_with_format(0, 0, "Region", &header_format)?;
    worksheet.write_string_with_format(0, 1, "Item", &header_format)?;
    worksheet.write_string_with_format(0, 2, "Volume", &header_format)?;
    worksheet.write_string_with_format(0, 3, "Month", &header_format)?;

    // Write the other worksheet data.
    for (row, data) in data.iter().enumerate() {
        let row = 1 + row as u32;
        worksheet.write_string(row, 0, data.0)?;
        worksheet.write_string(row, 1, data.1)?;
        worksheet.write_number(row, 2, data.2)?;
        worksheet.write_string(row, 3, data.3)?;
    }

    Ok(())
}
Example 10. Two pivot tables on the same worksheet.
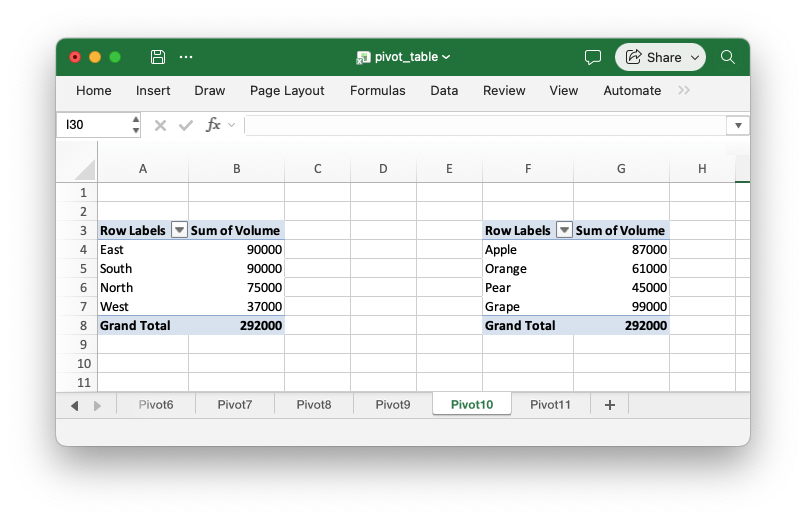
Code to generate the above example:
// SPDX-License-Identifier: MIT OR Apache-2.0
//
// Copyright 2022-2026, John McNamara, jmcnamara@cpan.org

//! An example of how to create pivot tables with the `rust_xlsxwriter` library.
//!
//! A pivot table is a way of grouping and summarizing the data in a worksheet
//! range.
//!

use rust_xlsxwriter::{
    Format, PivotTable, PivotTableFunction, PivotTableLayout, PivotTableStyle,
    PivotTableValueField, Workbook, Worksheet, XlsxError,
};

fn main() -> Result<(), XlsxError> {
    // Create a new Excel file object.
    let mut workbook = Workbook::new();

    // Add a worksheet with some sample data for the pivot tables.
    let worksheet = workbook.add_worksheet().set_name("Data")?;
    populate_pivot_data(worksheet)?;

    // -----------------------------------------------------------------------
    // 1. Add an empty pivot table.
    // -----------------------------------------------------------------------

    // Create a pivot table based on the worksheet data.
    let pivot_table = PivotTable::new().set_data_source("Data!A1:D51");

    // Add the pivot table to a new worksheet.
    let worksheet = workbook.add_worksheet().set_name("Pivot1")?;
    worksheet.add_pivot_table(2, 0, &pivot_table)?;

    // -----------------------------------------------------------------------
    // 2. Add a pivot table with a Row field and a Value field.
    // -----------------------------------------------------------------------

    // Create a pivot table based on the worksheet data and summarize the
    // "Volume" data by "Region". Note that the data source can also be
    // specified as a tuple.
    let pivot_table = PivotTable::new()
        .set_data_source(("Data", 0, 0, 50, 3))
        .add_row_field("Region")
        .add_value_field(&PivotTableValueField::new("Volume"));

    // Add the pivot table to a new worksheet.
    let worksheet = workbook.add_worksheet().set_name("Pivot2")?;
    worksheet.add_pivot_table(2, 0, &pivot_table)?;

    // -----------------------------------------------------------------------
    // 3. Add a pivot table with a Row field, a Column field and a Value field.
    // -----------------------------------------------------------------------

    // Create a pivot table based on the worksheet data and summarize the
    // "Volume" data by "Region" and "Item".
    let pivot_table = PivotTable::new()
        .set_data_source("Data!A1:D51")
        .add_row_field("Region")
        .add_column_field("Item")
        .add_value_field(&PivotTableValueField::new("Volume"));

    // Add the pivot table to a new worksheet.
    let worksheet = workbook.add_worksheet().set_name("Pivot3")?;
    worksheet.add_pivot_table(2, 0, &pivot_table)?;

    // -----------------------------------------------------------------------
    // 4. Add a pivot table with a Filter field.
    // -----------------------------------------------------------------------

    // Create a pivot table based on the worksheet data and summarize the
    // "Volume" data by "Region", with a filter on "Month".
    let pivot_table = PivotTable::new()
        .set_data_source("Data!A1:D51")
        .add_row_field("Region")
        .add_value_field(&PivotTableValueField::new("Volume"))
        .add_filter_field("Month");

    // Add the pivot table to a new worksheet. The filter is displayed in the
    // first row and the pivot table body starts in the third row.
    let worksheet = workbook.add_worksheet().set_name("Pivot4")?;
    worksheet.add_pivot_table(0, 0, &pivot_table)?;

    // -----------------------------------------------------------------------
    // 5. Add a pivot table with two Row fields.
    // -----------------------------------------------------------------------

    // Create a pivot table based on the worksheet data and summarize the
    // "Volume" data by "Region" and then by "Item" within each region.
    let pivot_table = PivotTable::new()
        .set_data_source("Data!A1:D51")
        .add_row_field("Region")
        .add_row_field("Item")
        .add_value_field(&PivotTableValueField::new("Volume"));

    // Add the pivot table to a new worksheet.
    let worksheet = workbook.add_worksheet().set_name("Pivot5")?;
    worksheet.add_pivot_table(2, 0, &pivot_table)?;

    // -----------------------------------------------------------------------
    // 6. Add a pivot table with several Value fields.
    // -----------------------------------------------------------------------

    // Create a pivot table based on the worksheet data and summarize the
    // "Volume" data by "Region" using different functions.
    let pivot_table = PivotTable::new()
        .set_data_source("Data!A1:D51")
        .add_row_field("Region")
        .add_value_field(&PivotTableValueField::new("Volume"))
        .add_value_field(
            &PivotTableValueField::new("Volume").set_function(PivotTableFunction::Count),
        )
        .add_value_field(
            &PivotTableValueField::new("Volume").set_function(PivotTableFunction::Average),
        );

    // Add the pivot table to a new worksheet.
    let worksheet = workbook.add_worksheet().set_name("Pivot6")?;
    worksheet.add_pivot_table(2, 0, &pivot_table)?;

    // -----------------------------------------------------------------------
    // 7. Add a pivot table with a custom name and number format.
    // -----------------------------------------------------------------------

    // Create a pivot table based on the worksheet data and summarize the
    // "Volume" data by "Region", with a custom name and number format.
    let pivot_table = PivotTable::new()
        .set_data_source("Data!A1:D51")
        .add_row_field("Region")
        .add_value_field(
            &PivotTableValueField::new("Volume")
                .set_custom_name("Total Volume")
                .set_num_format("#,##0"),
        );

    // Add the pivot table to a new worksheet.
    let worksheet = workbook.add_worksheet().set_name("Pivot7")?;
    worksheet.add_pivot_table(2, 0, &pivot_table)?;

    // -----------------------------------------------------------------------
    // 8. Add a pivot table with a different style and no grand totals.
    // -----------------------------------------------------------------------

    // Create a pivot table based on the worksheet data and summarize the
    // "Volume" data by "Region" and "Item", without grand totals.
    let pivot_table = PivotTable::new()
        .set_data_source("Data!A1:D51")
        .add_row_field("Region")
        .add_column_field("Item")
        .add_value_field(&PivotTableValueField::new("Volume"))
        .set_style(PivotTableStyle::Medium9)
        .set_row_grand_totals(false)
        .set_column_grand_totals(false);

    // Add the pivot table to a new worksheet.
    let worksheet = workbook.add_worksheet().set_name("Pivot8")?;
    worksheet.add_pivot_table(2, 0, &pivot_table)?;

    // -----------------------------------------------------------------------
    // 9. Add a pivot table with a tabular layout.
    // -----------------------------------------------------------------------

    // Create a pivot table based on the worksheet data and summarize the
    // "Volume" data by "Region" and "Item", with each row field in its own
    // column.
    let pivot_table = PivotTable::new()
        .set_data_source("Data!A1:D51")
        .add_row_field("Region")
        .add_row_field("Item")
        .add_value_field(&PivotTableValueField::new("Volume"))
        .set_layout(PivotTableLayout::Tabular);

    // Add the pivot table to a new worksheet.
    let worksheet = workbook.add_worksheet().set_name("Pivot9")?;
    worksheet.add_pivot_table(2, 0, &pivot_table)?;

    // -----------------------------------------------------------------------
    // 10. Add two pivot tables to the same worksheet.
    // -----------------------------------------------------------------------

    // Create two pivot tables based on the worksheet data and summarize the
    // "Volume" data by "Region" in one and by "Item" in the other.
    let pivot_table1 = PivotTable::new()
        .set_data_source("Data!A1:D51")
        .add_row_field("Region")
        .add_value_field(&PivotTableValueField::new("Volume"));

    let pivot_table2 = PivotTable::new()
        .set_data_source("Data!A1:D51")
        .add_row_field("Item")
        .add_value_field(&PivotTableValueField::new("Volume"));

    // Add the pivot tables side by side on a new worksheet.
    let worksheet = workbook.add_worksheet().set_name("Pivot10")?;
    worksheet.add_pivot_table(2, 0, &pivot_table1)?;
    worksheet.add_pivot_table(2, 5, &pivot_table2)?;

    // -----------------------------------------------------------------------
    // 11. Add a pivot table to the same worksheet as the data.
    // -----------------------------------------------------------------------

    // Add a new worksheet with a copy of the sample data.
    let worksheet = workbook.add_worksheet().set_name("Pivot11")?;
    populate_pivot_data(worksheet)?;

    // Create a pivot table based on the data in the same worksheet and
    // summarize the "Volume" data by "Region".
    let pivot_table = PivotTable::new()
        .set_data_source("Pivot11!A1:D51")
        .add_row_field("Region")
        .add_value_field(&PivotTableValueField::new("Volume"));

    // Add the pivot table to the right of the data.
    worksheet.add_pivot_table(2, 6, &pivot_table)?;

    // Save the file to disk.
    workbook.save("pivot_table.xlsx")?;

    Ok(())
}

// Generate worksheet data for the pivot tables.
pub fn populate_pivot_data(worksheet: &mut Worksheet) -> Result<(), XlsxError> {
    // The sample data to add to the worksheet.
    let data = [
        ("East", "Apple", 9000, "July"),
        ("East", "Apple", 5000, "April"),
        ("South", "Orange", 9000, "September"),
        ("North", "Apple", 2000, "November"),
        ("West", "Apple", 9000, "November"),
        ("South", "Pear", 7000, "October"),
        ("North", "Pear", 9000, "August"),
        ("West", "Orange", 1000, "December"),
        ("West", "Grape", 1000, "November"),
        ("South", "Pear", 10000, "April"),
        ("West", "Grape", 6000, "January"),
        ("South", "Orange", 3000, "May"),
        ("North", "Apple", 3000, "December"),
        ("South", "Apple", 7000, "February"),
        ("West", "Grape", 1000, "December"),
        ("East", "Grape", 8000, "February"),
        ("South", "Grape", 10000, "June"),
        ("West", "Pear", 7000, "December"),
        ("South", "Apple", 2000, "October"),
        ("East", "Grape", 7000, "December"),
        ("North", "Grape", 6000, "July"),
        ("East", "Pear", 8000, "February"),
        ("North", "Apple", 7000, "August"),
        ("North", "Orange", 7000, "July"),
        ("North", "Apple", 6000, "June"),
        ("South", "Grape", 8000, "September"),
        ("West", "Apple", 3000, "October"),
        ("South", "Orange", 10000, "November"),
        ("West", "Grape", 4000, "December"),
        ("North", "Orange", 5000, "August"),
        ("East", "Orange", 1000, "November"),
        ("East", "Orange", 4000, "October"),
        ("North", "Grape", 5000, "August"),
        ("East", "Apple", 1000, "July"),
        ("South", "Apple", 10000, "March"),
        ("East", "Grape", 7000, "October"),
        ("West", "Grape", 1000, "September"),
        ("East", "Grape", 10000, "October"),
        ("South", "Orange", 8000, "March"),
        ("North", "Apple", 4000, "July"),
        ("South", "Orange", 5000, "July"),
        ("West", "Apple", 4000, "June"),
        ("East", "Apple", 5000, "April"),
        ("North", "Pear", 3000, "August"),
        ("East", "Grape", 9000, "November"),
        ("North", "Orange", 8000, "October"),
        ("East", "Apple", 10000, "June"),
        ("South", "Pear", 1000, "December"),
        ("North", "Grape", 10000, "July"),
        ("East", "Grape", 6000, "February"),
    ];

    // Widen the columns for clarity.
    worksheet.set_column_width(0, 12)?;
    worksheet.set_column_width(1, 12)?;
    worksheet.set_column_width(2, 12)?;
    worksheet.set_column_width(3, 12)?;

    // Write the header titles.
    let header_format = Format::new().set_bold();
    worksheet.write_string_with_format(0, 0, "Region", &header_format)?;
    worksheet.write_string_with_format(0, 1, "Item", &header_format)?;
    worksheet.write_string_with_format(0, 2, "Volume", &header_format)?;
    worksheet.write_string_with_format(0, 3, "Month", &header_format)?;

    // Write the other worksheet data.
    for (row, data) in data.iter().enumerate() {
        let row = 1 + row as u32;
        worksheet.write_string(row, 0, data.0)?;
        worksheet.write_string(row, 1, data.1)?;
        worksheet.write_number(row, 2, data.2)?;
        worksheet.write_string(row, 3, data.3)?;
    }

    Ok(())
}
Example 11. Pivot table on the same worksheet as the source data.
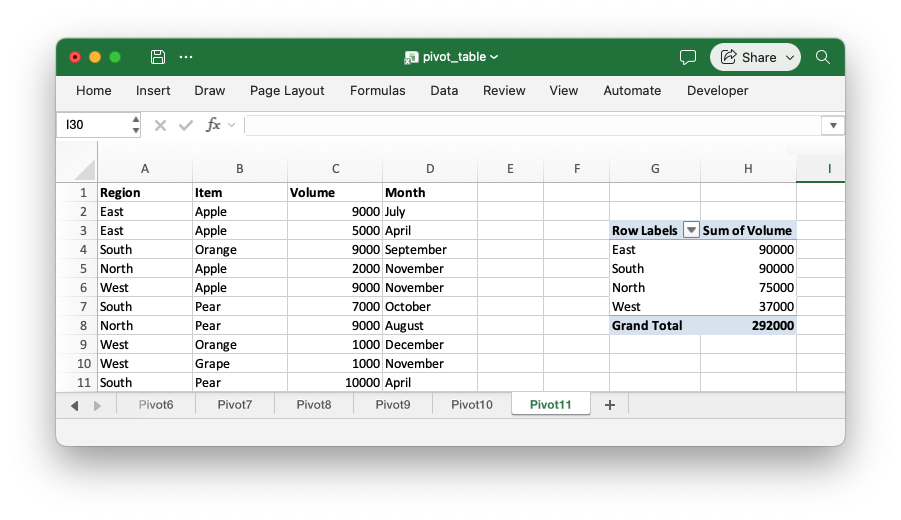
Code to generate the above example:
// SPDX-License-Identifier: MIT OR Apache-2.0
//
// Copyright 2022-2026, John McNamara, jmcnamara@cpan.org

//! An example of how to create pivot tables with the `rust_xlsxwriter` library.
//!
//! A pivot table is a way of grouping and summarizing the data in a worksheet
//! range.
//!

use rust_xlsxwriter::{
    Format, PivotTable, PivotTableFunction, PivotTableLayout, PivotTableStyle,
    PivotTableValueField, Workbook, Worksheet, XlsxError,
};

fn main() -> Result<(), XlsxError> {
    // Create a new Excel file object.
    let mut workbook = Workbook::new();

    // Add a worksheet with some sample data for the pivot tables.
    let worksheet = workbook.add_worksheet().set_name("Data")?;
    populate_pivot_data(worksheet)?;

    // -----------------------------------------------------------------------
    // 1. Add an empty pivot table.
    // -----------------------------------------------------------------------

    // Create a pivot table based on the worksheet data.
    let pivot_table = PivotTable::new().set_data_source("Data!A1:D51");

    // Add the pivot table to a new worksheet.
    let worksheet = workbook.add_worksheet().set_name("Pivot1")?;
    worksheet.add_pivot_table(2, 0, &pivot_table)?;

    // -----------------------------------------------------------------------
    // 2. Add a pivot table with a Row field and a Value field.
    // -----------------------------------------------------------------------

    // Create a pivot table based on the worksheet data and summarize the
    // "Volume" data by "Region". Note that the data source can also be
    // specified as a tuple.
    let pivot_table = PivotTable::new()
        .set_data_source(("Data", 0, 0, 50, 3))
        .add_row_field("Region")
        .add_value_field(&PivotTableValueField::new("Volume"));

    // Add the pivot table to a new worksheet.
    let worksheet = workbook.add_worksheet().set_name("Pivot2")?;
    worksheet.add_pivot_table(2, 0, &pivot_table)?;

    // -----------------------------------------------------------------------
    // 3. Add a pivot table with a Row field, a Column field and a Value field.
    // -----------------------------------------------------------------------

    // Create a pivot table based on the worksheet data and summarize the
    // "Volume" data by "Region" and "Item".
    let pivot_table = PivotTable::new()
        .set_data_source("Data!A1:D51")
        .add_row_field("Region")
        .add_column_field("Item")
        .add_value_field(&PivotTableValueField::new("Volume"));

    // Add the pivot table to a new worksheet.
    let worksheet = workbook.add_worksheet().set_name("Pivot3")?;
    worksheet.add_pivot_table(2, 0, &pivot_table)?;

    // -----------------------------------------------------------------------
    // 4. Add a pivot table with a Filter field.
    // -----------------------------------------------------------------------

    // Create a pivot table based on the worksheet data and summarize the
    // "Volume" data by "Region", with a filter on "Month".
    let pivot_table = PivotTable::new()
        .set_data_source("Data!A1:D51")
        .add_row_field("Region")
        .add_value_field(&PivotTableValueField::new("Volume"))
        .add_filter_field("Month");

    // Add the pivot table to a new worksheet. The filter is displayed in the
    // first row and the pivot table body starts in the third row.
    let worksheet = workbook.add_worksheet().set_name("Pivot4")?;
    worksheet.add_pivot_table(0, 0, &pivot_table)?;

    // -----------------------------------------------------------------------
    // 5. Add a pivot table with two Row fields.
    // -----------------------------------------------------------------------

    // Create a pivot table based on the worksheet data and summarize the
    // "Volume" data by "Region" and then by "Item" within each region.
    let pivot_table = PivotTable::new()
        .set_data_source("Data!A1:D51")
        .add_row_field("Region")
        .add_row_field("Item")
        .add_value_field(&PivotTableValueField::new("Volume"));

    // Add the pivot table to a new worksheet.
    let worksheet = workbook.add_worksheet().set_name("Pivot5")?;
    worksheet.add_pivot_table(2, 0, &pivot_table)?;

    // -----------------------------------------------------------------------
    // 6. Add a pivot table with several Value fields.
    // -----------------------------------------------------------------------

    // Create a pivot table based on the worksheet data and summarize the
    // "Volume" data by "Region" using different functions.
    let pivot_table = PivotTable::new()
        .set_data_source("Data!A1:D51")
        .add_row_field("Region")
        .add_value_field(&PivotTableValueField::new("Volume"))
        .add_value_field(
            &PivotTableValueField::new("Volume").set_function(PivotTableFunction::Count),
        )
        .add_value_field(
            &PivotTableValueField::new("Volume").set_function(PivotTableFunction::Average),
        );

    // Add the pivot table to a new worksheet.
    let worksheet = workbook.add_worksheet().set_name("Pivot6")?;
    worksheet.add_pivot_table(2, 0, &pivot_table)?;

    // -----------------------------------------------------------------------
    // 7. Add a pivot table with a custom name and number format.
    // -----------------------------------------------------------------------

    // Create a pivot table based on the worksheet data and summarize the
    // "Volume" data by "Region", with a custom name and number format.
    let pivot_table = PivotTable::new()
        .set_data_source("Data!A1:D51")
        .add_row_field("Region")
        .add_value_field(
            &PivotTableValueField::new("Volume")
                .set_custom_name("Total Volume")
                .set_num_format("#,##0"),
        );

    // Add the pivot table to a new worksheet.
    let worksheet = workbook.add_worksheet().set_name("Pivot7")?;
    worksheet.add_pivot_table(2, 0, &pivot_table)?;

    // -----------------------------------------------------------------------
    // 8. Add a pivot table with a different style and no grand totals.
    // -----------------------------------------------------------------------

    // Create a pivot table based on the worksheet data and summarize the
    // "Volume" data by "Region" and "Item", without grand totals.
    let pivot_table = PivotTable::new()
        .set_data_source("Data!A1:D51")
        .add_row_field("Region")
        .add_column_field("Item")
        .add_value_field(&PivotTableValueField::new("Volume"))
        .set_style(PivotTableStyle::Medium9)
        .set_row_grand_totals(false)
        .set_column_grand_totals(false);

    // Add the pivot table to a new worksheet.
    let worksheet = workbook.add_worksheet().set_name("Pivot8")?;
    worksheet.add_pivot_table(2, 0, &pivot_table)?;

    // -----------------------------------------------------------------------
    // 9. Add a pivot table with a tabular layout.
    // -----------------------------------------------------------------------

    // Create a pivot table based on the worksheet data and summarize the
    // "Volume" data by "Region" and "Item", with each row field in its own
    // column.
    let pivot_table = PivotTable::new()
        .set_data_source("Data!A1:D51")
        .add_row_field("Region")
        .add_row_field("Item")
        .add_value_field(&PivotTableValueField::new("Volume"))
        .set_layout(PivotTableLayout::Tabular);

    // Add the pivot table to a new worksheet.
    let worksheet = workbook.add_worksheet().set_name("Pivot9")?;
    worksheet.add_pivot_table(2, 0, &pivot_table)?;

    // -----------------------------------------------------------------------
    // 10. Add two pivot tables to the same worksheet.
    // -----------------------------------------------------------------------

    // Create two pivot tables based on the worksheet data and summarize the
    // "Volume" data by "Region" in one and by "Item" in the other.
    let pivot_table1 = PivotTable::new()
        .set_data_source("Data!A1:D51")
        .add_row_field("Region")
        .add_value_field(&PivotTableValueField::new("Volume"));

    let pivot_table2 = PivotTable::new()
        .set_data_source("Data!A1:D51")
        .add_row_field("Item")
        .add_value_field(&PivotTableValueField::new("Volume"));

    // Add the pivot tables side by side on a new worksheet.
    let worksheet = workbook.add_worksheet().set_name("Pivot10")?;
    worksheet.add_pivot_table(2, 0, &pivot_table1)?;
    worksheet.add_pivot_table(2, 5, &pivot_table2)?;

    // -----------------------------------------------------------------------
    // 11. Add a pivot table to the same worksheet as the data.
    // -----------------------------------------------------------------------

    // Add a new worksheet with a copy of the sample data.
    let worksheet = workbook.add_worksheet().set_name("Pivot11")?;
    populate_pivot_data(worksheet)?;

    // Create a pivot table based on the data in the same worksheet and
    // summarize the "Volume" data by "Region".
    let pivot_table = PivotTable::new()
        .set_data_source("Pivot11!A1:D51")
        .add_row_field("Region")
        .add_value_field(&PivotTableValueField::new("Volume"));

    // Add the pivot table to the right of the data.
    worksheet.add_pivot_table(2, 6, &pivot_table)?;

    // Save the file to disk.
    workbook.save("pivot_table.xlsx")?;

    Ok(())
}

// Generate worksheet data for the pivot tables.
pub fn populate_pivot_data(worksheet: &mut Worksheet) -> Result<(), XlsxError> {
    // The sample data to add to the worksheet.
    let data = [
        ("East", "Apple", 9000, "July"),
        ("East", "Apple", 5000, "April"),
        ("South", "Orange", 9000, "September"),
        ("North", "Apple", 2000, "November"),
        ("West", "Apple", 9000, "November"),
        ("South", "Pear", 7000, "October"),
        ("North", "Pear", 9000, "August"),
        ("West", "Orange", 1000, "December"),
        ("West", "Grape", 1000, "November"),
        ("South", "Pear", 10000, "April"),
        ("West", "Grape", 6000, "January"),
        ("South", "Orange", 3000, "May"),
        ("North", "Apple", 3000, "December"),
        ("South", "Apple", 7000, "February"),
        ("West", "Grape", 1000, "December"),
        ("East", "Grape", 8000, "February"),
        ("South", "Grape", 10000, "June"),
        ("West", "Pear", 7000, "December"),
        ("South", "Apple", 2000, "October"),
        ("East", "Grape", 7000, "December"),
        ("North", "Grape", 6000, "July"),
        ("East", "Pear", 8000, "February"),
        ("North", "Apple", 7000, "August"),
        ("North", "Orange", 7000, "July"),
        ("North", "Apple", 6000, "June"),
        ("South", "Grape", 8000, "September"),
        ("West", "Apple", 3000, "October"),
        ("South", "Orange", 10000, "November"),
        ("West", "Grape", 4000, "December"),
        ("North", "Orange", 5000, "August"),
        ("East", "Orange", 1000, "November"),
        ("East", "Orange", 4000, "October"),
        ("North", "Grape", 5000, "August"),
        ("East", "Apple", 1000, "July"),
        ("South", "Apple", 10000, "March"),
        ("East", "Grape", 7000, "October"),
        ("West", "Grape", 1000, "September"),
        ("East", "Grape", 10000, "October"),
        ("South", "Orange", 8000, "March"),
        ("North", "Apple", 4000, "July"),
        ("South", "Orange", 5000, "July"),
        ("West", "Apple", 4000, "June"),
        ("East", "Apple", 5000, "April"),
        ("North", "Pear", 3000, "August"),
        ("East", "Grape", 9000, "November"),
        ("North", "Orange", 8000, "October"),
        ("East", "Apple", 10000, "June"),
        ("South", "Pear", 1000, "December"),
        ("North", "Grape", 10000, "July"),
        ("East", "Grape", 6000, "February"),
    ];

    // Widen the columns for clarity.
    worksheet.set_column_width(0, 12)?;
    worksheet.set_column_width(1, 12)?;
    worksheet.set_column_width(2, 12)?;
    worksheet.set_column_width(3, 12)?;

    // Write the header titles.
    let header_format = Format::new().set_bold();
    worksheet.write_string_with_format(0, 0, "Region", &header_format)?;
    worksheet.write_string_with_format(0, 1, "Item", &header_format)?;
    worksheet.write_string_with_format(0, 2, "Volume", &header_format)?;
    worksheet.write_string_with_format(0, 3, "Month", &header_format)?;

    // Write the other worksheet data.
    for (row, data) in data.iter().enumerate() {
        let row = 1 + row as u32;
        worksheet.write_string(row, 0, data.0)?;
        worksheet.write_string(row, 1, data.1)?;
        worksheet.write_number(row, 2, data.2)?;
        worksheet.write_string(row, 3, data.3)?;
    }

    Ok(())
}