Working with Charts
The sections below explain some of the options and features when working
with the Chart struct.
Creating a chart with rust_xlsxwriter
The basic steps for creating a chart in rust_xlsxwriter are:
- Create a new
Chartobject of the chart type you want. - Add one or more series to the chart via
Chart::add_series()to define the data you wish to plot. - Add any formatting or additional feature you need.
- Add the chart to the worksheet via
Worksheet::insert_chart().
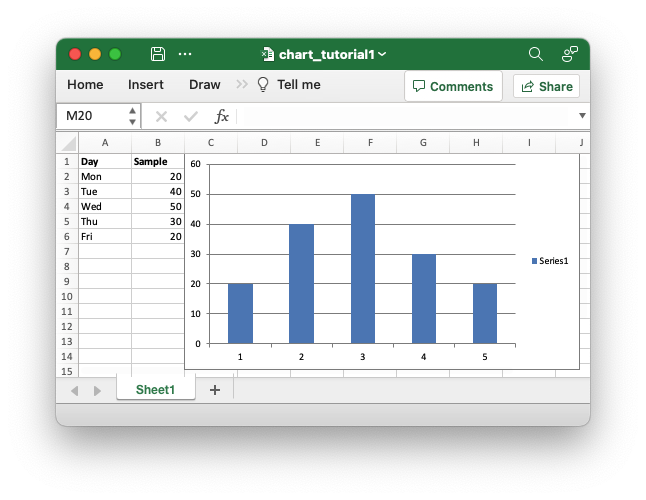
These steps are shown in the example below which creates a minimal chart
that plots data in a worksheet. The program creates a new column Chart,
adds a series via Chart::add_series() and add the value range the series
refers to via [ChartSeries::set_values()]:
// SPDX-License-Identifier: MIT OR Apache-2.0
//
// Copyright 2022-2026, John McNamara, jmcnamara@cpan.org

//! An example of creating a simple chart using the `rust_xlsxwriter` library.

use rust_xlsxwriter::{Chart, ChartType, Format, Workbook, XlsxError};

fn main() -> Result<(), XlsxError> {
    let mut workbook = Workbook::new();
    let worksheet = workbook.add_worksheet();
    let bold = Format::new().set_bold();

    // Add the worksheet data that the charts will refer to.
    let categories = ["Mon", "Tue", "Wed", "Thu", "Fri"];
    let values = [20, 40, 50, 30, 20];

    worksheet.write_with_format(0, 0, "Day", &bold)?;
    worksheet.write_column(1, 0, categories)?;

    worksheet.write_with_format(0, 1, "Sample", &bold)?;
    worksheet.write_column(1, 1, values)?;

    // Create a new column chart.
    let mut chart = Chart::new(ChartType::Column);

    // Configure the data series for the chart.
    chart.add_series().set_values("Sheet1!$B$2:$B$6");

    // Add the chart to the worksheet.
    worksheet.insert_chart(0, 2, &chart)?;

    workbook.save("chart_tutorial1.xlsx")?;

    Ok(())
}
This produces a file like this:
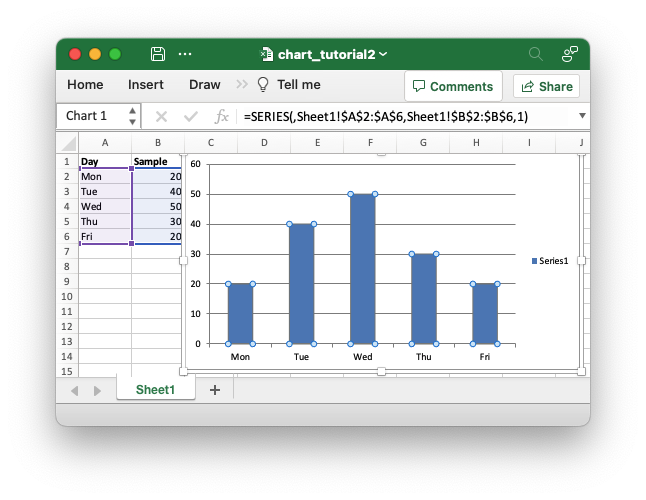
To improve this a little we will add the category data that the value data
refers to. In this case it is the "Day" data in Column A. We extend the
program by adding the category values via [ChartSeries::set_categories()]:
// SPDX-License-Identifier: MIT OR Apache-2.0
//
// Copyright 2022-2026, John McNamara, jmcnamara@cpan.org

//! An example of creating a simple chart using the `rust_xlsxwriter` library.

use rust_xlsxwriter::{Chart, ChartType, Format, Workbook, XlsxError};

fn main() -> Result<(), XlsxError> {
    let mut workbook = Workbook::new();
    let worksheet = workbook.add_worksheet();
    let bold = Format::new().set_bold();

    // Add the worksheet data that the charts will refer to.
    let categories = ["Mon", "Tue", "Wed", "Thu", "Fri"];
    let values = [20, 40, 50, 30, 20];

    worksheet.write_with_format(0, 0, "Day", &bold)?;
    worksheet.write_column(1, 0, categories)?;

    worksheet.write_with_format(0, 1, "Sample", &bold)?;
    worksheet.write_column(1, 1, values)?;

    // Create a new column chart.
    let mut chart = Chart::new(ChartType::Column);

    // Configure the data series for the chart.
    chart
        .add_series()
        .set_categories("Sheet1!$A$2:$A$6")
        .set_values("Sheet1!$B$2:$B$6");

    // Add the chart to the worksheet.
    worksheet.insert_chart(0, 2, &chart)?;

    workbook.save("chart_tutorial2.xlsx")?;

    Ok(())
}
(Note: The section of the program where we write the worksheet data is the same as the previous example and is omitted in this example. You can view it in the source or the examples folder.)
The updated file looks like this (the chart data range is highlighted):
The previous example works fine but it contained some hard-coded cell ranges
like set_values("Sheet1!$B$2:$B$6"). This is okay for simple programs but
if our example changed to have a different number of data items then we
would have to manually change the code to adjust for the new ranges.
Fortunately, these hard-coded values are only used for the sake of the
example and rust_xlsxwriter provides APIs to handle these more
programmatically.
In general rust_xlsxwriter always provides numeric APIs for any ranges in
Excel but when it makes ergonomic sense it also provides secondary
string-based APIs. The previous example uses one of these secondary string-
based APIs for demonstration purposes. For real applications you would set
the chart ranges using 5-tuple values like this:
// SPDX-License-Identifier: MIT OR Apache-2.0
//
// Copyright 2022-2026, John McNamara, jmcnamara@cpan.org

//! An example of creating a simple chart using the `rust_xlsxwriter` library.

use rust_xlsxwriter::{Chart, ChartType, Format, Workbook, XlsxError};

fn main() -> Result<(), XlsxError> {
    let mut workbook = Workbook::new();
    let worksheet = workbook.add_worksheet();
    let bold = Format::new().set_bold();

    // Add the worksheet data that the charts will refer to.
    let categories = ["Mon", "Tue", "Wed", "Thu", "Fri"];
    let values = [20, 40, 50, 30, 20];

    worksheet.write_with_format(0, 0, "Day", &bold)?;
    worksheet.write_column(1, 0, categories)?;

    worksheet.write_with_format(0, 1, "Sample", &bold)?;
    worksheet.write_column(1, 1, values)?;

    // Set some variables to define the chart range.
    let row_min = 1;
    let row_max = values.len() as u32;
    let col_cat = 0;
    let col_val = 1;

    // Create a new column chart.
    let mut chart = Chart::new(ChartType::Column);

    // Configure the data series for the chart.
    chart
        .add_series()
        .set_categories(("Sheet1", row_min, col_cat, row_max, col_cat))
        .set_values(("Sheet1", row_min, col_val, row_max, col_val));

    // Add the chart to the worksheet.
    worksheet.insert_chart(0, 2, &chart)?;

    workbook.save("chart_tutorial3.xlsx")?;

    Ok(())
}
We could use hard coded row and column indexes for the chart ranges but the variables make it more flexible and future proof. The output from this example is exactly the same as the previous image above.
Finally we can improve the output a bit more by inserting chart and axes
titles, by hiding the legend since it doesn't provide much information in
this case, and by shifting the chart a few pixels away from the data for
clarity via
Worksheet::insert_chart_with_offset().
Here is the chart section with these changes:
// SPDX-License-Identifier: MIT OR Apache-2.0
//
// Copyright 2022-2026, John McNamara, jmcnamara@cpan.org

//! An example of creating a simple chart using the `rust_xlsxwriter` library.

use rust_xlsxwriter::{Chart, ChartType, Format, Workbook, XlsxError};

fn main() -> Result<(), XlsxError> {
    let mut workbook = Workbook::new();
    let worksheet = workbook.add_worksheet();
    let bold = Format::new().set_bold();

    // Add the worksheet data that the charts will refer to.
    let categories = ["Mon", "Tue", "Wed", "Thu", "Fri"];
    let values = [20, 40, 50, 30, 20];

    worksheet.write_with_format(0, 0, "Day", &bold)?;
    worksheet.write_column(1, 0, categories)?;

    worksheet.write_with_format(0, 1, "Sample", &bold)?;
    worksheet.write_column(1, 1, values)?;

    // Set some variables to define the chart range.
    let row_min = 1;
    let row_max = values.len() as u32;
    let col_cat = 0;
    let col_val = 1;

    // Create a new column chart.
    let mut chart = Chart::new(ChartType::Column);

    // Configure the data series for the chart.
    chart
        .add_series()
        .set_categories(("Sheet1", row_min, col_cat, row_max, col_cat))
        .set_values(("Sheet1", row_min, col_val, row_max, col_val));

    // Add a chart title and some axis labels.
    chart.title().set_name("Results of sample tests");
    chart.x_axis().set_name("Test day");
    chart.y_axis().set_name("Sample length (mm)");

    // Turn off the chart legend.
    chart.legend().set_hidden();

    // Add the chart to the worksheet.
    worksheet.insert_chart_with_offset(0, 2, &chart, 5, 5)?;

    workbook.save("chart_tutorial4.xlsx")?;

    Ok(())
}
This produces a file like this:

For more examples see chart examples in the Cookbook.
Supported chart types
The rust_xlsxwriter library supports the main original Excel chart types
such as:
- Area
- Bar
- Column
- Doughnut
- Line
- Pie
- Radar
- Stock
- Scatter
See ChartType for the full list and examples.
Support for newer Excel chart types such as Treemap, Sunburst, Box and Whisker, Statistical Histogram, Waterfall, Funnel, and Maps is not currently planned since the underlying structure is substantially different from the original chart types above.
Chart formatting
Excel uses a standard dialog for any chart elements that support formatting such as data series, the plot area, the chart area, the legend or individual points. It looks like this:

In rust_xlsxwriter the ChartFormat struct represents many of these
format options and just like Excel it offers a standard formatting interface
for a number of the chart elements.
The ChartFormat struct is generally passed to the set_format() method
of a chart element. ChartFormat supports several child formatting structs
such as:
ChartSolidFillproperties for solid fills.ChartPatternFillfor pattern fills.ChartGradientFillfor gradient fills.ChartLinefor line/border properties.
As a syntactic shortcut you can pass any of the child format structs to
set_format(). This allows you to create and use a ChartLine struct,
for example, without having to construct a parent ChartFormat. However,
if you mix more than one type of format you will need a parent
ChartFormat struct to group them.
Chart Value and Category Axes
When working with charts it is important to understand how Excel differentiates between a chart axis that is used for data series "Categories" and a chart axis that is used for data series "Values".
The majority of Excel charts types have a "Category" X-axis axis where each of the values is evenly spaced and sequential. The category values can be strings, like in the example below, or they can be numbers. When the categories are numbers, Excel treats them as if they were strings, which is why you can't set a minimum or maximum limit in Category axes.

Column chart with Category X-axis and Value Y-axis
The Y-axis of Excel charts is generally a "Value" axis where points are displayed according to their value. This type of axis does support minimum and maximum limits.
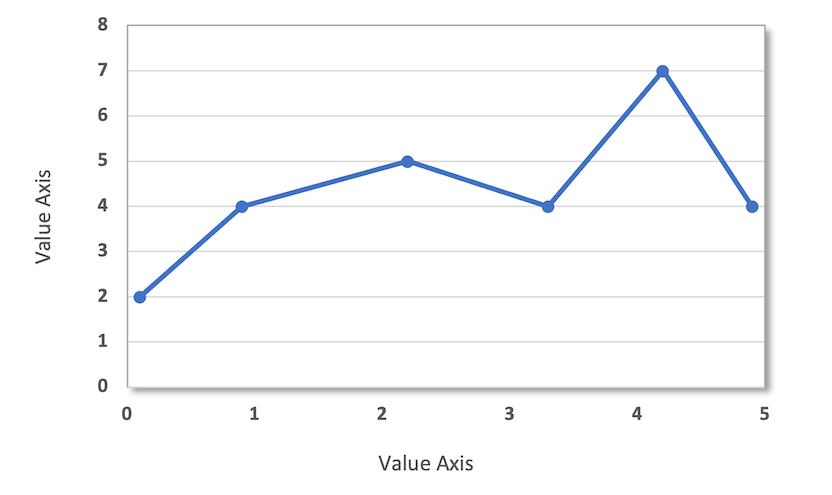
Scatter charts are an exception to the general rule since they have two
value axes to plot (x, y) data that doesn't necessarily lie on
fixed X-axis divisions, as shown in the chart below:
Scatter chart with Value X-axis and Value Y-axis
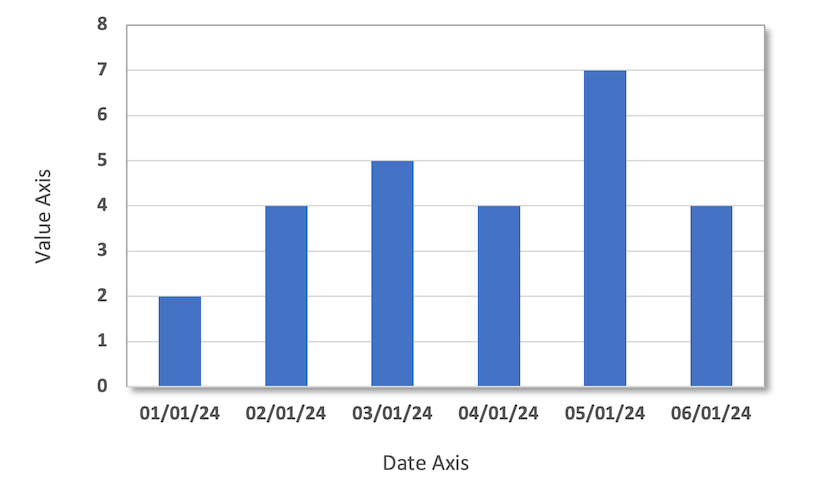
Another variation is a category-style chart with date or time values for
the X-axis. This type of "Date" axis shares properties of Category and Value
axes. Date axes are used in Stock charts or if you provide date/time data
and use the ChartAxis::set_date_axis() method.
Column chart with Date X-axis and Value Y-axis
Finally, another variant is a Bar chart where the Category and Value axes positions are reversed:
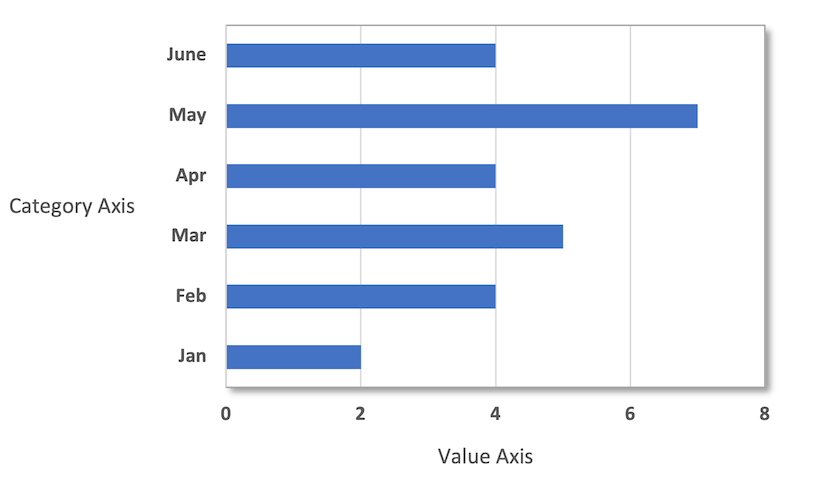
Bar chart with Category Y-axis and Value X-axis
In Excel, category and value axes expose different properties, as can be seen in the dialogs for each type of axis, shown below. Note that for Category axes, there is no minimum and maximum "Bounds" option:


Due to Excel's distinction between axis types, some rust_xlsxwriter
ChartAxis properties can be set for a value axis, some can be set for a
category axis, and some properties can be set for both. For example, reverse
can be set for either category or value axes, while the min and max
properties can only be set for value axes (and date axes). The documentation
calls out the type of axis to which properties apply.
Secondary Axes
It is possible to add a secondary axis of the same type to a chart by
setting the ChartSeries::set_secondary_axis() property of the series:
// SPDX-License-Identifier: MIT OR Apache-2.0
//
// Copyright 2022-2026, John McNamara, jmcnamara@cpan.org

//! A chart example demonstrating setting a secondary Y axis.

use rust_xlsxwriter::{Chart, ChartLegendPosition, ChartType, Workbook, XlsxError};

fn main() -> Result<(), XlsxError> {
    let mut workbook = Workbook::new();
    let worksheet = workbook.add_worksheet();

    // Add the worksheet data that the charts will refer to.
    worksheet.write_column(0, 0, [2, 3, 4, 5, 6, 7])?;
    worksheet.write_column(0, 1, [10, 40, 50, 20, 10, 50])?;

    // Create a new line chart.
    let mut chart = Chart::new(ChartType::Line);

    // Configure a series that defaults to the primary axis.
    chart.add_series().set_values("Sheet1!$A$1:$A$6");

    // Configure another series with a secondary axis.
    chart
        .add_series()
        .set_values("Sheet1!$B$1:$B$6")
        .set_secondary_axis(true);

    // Add some axis labels.
    chart.y_axis().set_name("Y axis");
    chart.y2_axis().set_name("Y2 axis");

    // Move the legend to the bottom for clarity.
    chart.legend().set_position(ChartLegendPosition::Bottom);

    // Add the chart to the worksheet.
    worksheet.insert_chart_with_offset(0, 2, &chart, 5, 5)?;

    workbook.save("chart.xlsx")?;

    Ok(())
}
Output file:
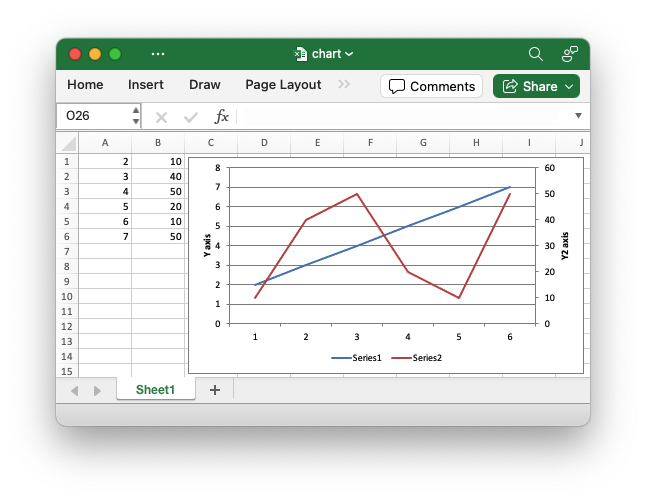
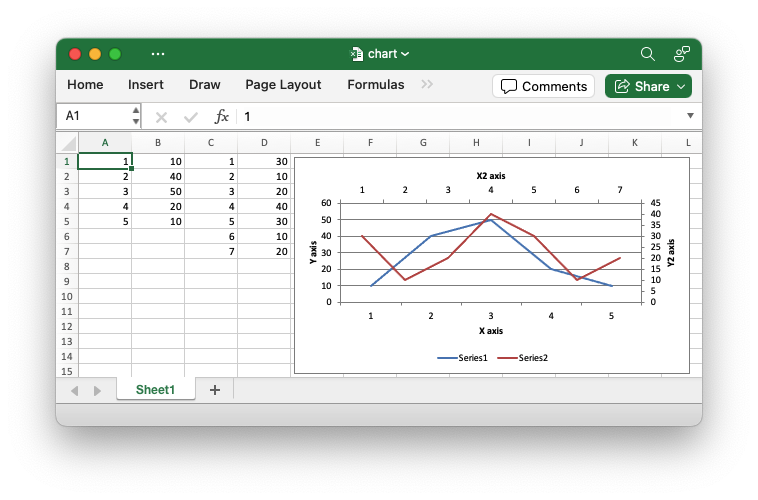
In general secondary axes are used for displaying different Y values for the same category range. However it is also possible to display a secondary X axis for series that use a different category range. See the example below.
// SPDX-License-Identifier: MIT OR Apache-2.0
//
// Copyright 2022-2026, John McNamara, jmcnamara@cpan.org

//! A chart example demonstrating using a secondary X and Y axis. The secondary
//! X axis is only available for chart series that have a category range that is
//! different from the primary category range.

use rust_xlsxwriter::{
    Chart, ChartAxisCrossing, ChartAxisLabelPosition, ChartLegendPosition, ChartType, Workbook,
    XlsxError,
};

fn main() -> Result<(), XlsxError> {
    let mut workbook = Workbook::new();
    let worksheet = workbook.add_worksheet();

    // Add the worksheet data that the charts will refer to.
    worksheet.write_column(0, 0, [1, 2, 3, 4, 5])?;
    worksheet.write_column(0, 1, [10, 40, 50, 20, 10])?;
    worksheet.write_column(0, 2, [1, 2, 3, 4, 5, 6, 7])?;
    worksheet.write_column(0, 3, [30, 10, 20, 40, 30, 10, 20])?;

    // Create a new line chart.
    let mut chart = Chart::new(ChartType::Line);

    // Configure a series that defaults to the primary axis.
    chart
        .add_series()
        .set_categories(("Sheet1", 0, 0, 4, 0))
        .set_values(("Sheet1", 0, 1, 4, 1));

    // Configure another series with a secondary axis. Note that the category
    // range is different to the primary axes series.
    chart
        .add_series()
        .set_categories(("Sheet1", 0, 2, 6, 2))
        .set_values(("Sheet1", 0, 3, 6, 3))
        .set_secondary_axis(true);

    // Make the secondary X axis visible (it is hidden by default) and also
    // position the labels so they are next to the axis and therefore visible.
    chart
        .x2_axis()
        .set_hidden(false)
        .set_label_position(ChartAxisLabelPosition::NextTo);

    // Set the X2 axis to cross the Y2 axis at the max value so it appears at
    // the top of the chart.
    chart.y2_axis().set_crossing(ChartAxisCrossing::Max);

    // Add some axis labels.
    chart.x_axis().set_name("X axis");
    chart.y_axis().set_name("Y axis");
    chart.x2_axis().set_name("X2 axis");
    chart.y2_axis().set_name("Y2 axis");

    // Move the legend to the bottom for clarity.
    chart.legend().set_position(ChartLegendPosition::Bottom);

    // Add the chart to the worksheet.
    worksheet.insert_chart_with_offset(0, 4, &chart, 5, 5)?;

    workbook.save("chart.xlsx")?;

    Ok(())
}
Output file:
It is also possible to have a secondary, combined, chart either with a shared or secondary axis, see below.
Combined Charts
In Excel is also possible to combine two different chart types, for example
a column and line chart to create a Pareto chart. In rust_xlsxwriter you
can replicate this by creating a new chart instance as the primary chart and
then create a secondary chart of a different type and combine it with the
primary chart using the Chart::combine() method.
The combined secondary chart can share the same Y axis as the primary chart, or it can use a secondary Y2 axis. An example of each is shown below.
Combined Column and Line chart with the same Y axis.
// SPDX-License-Identifier: MIT OR Apache-2.0
//
// Copyright 2022-2026, John McNamara, jmcnamara@cpan.org

//! An example of creating a combined Column and Line chart. In this example
//! they share the same primary Y axis.

use rust_xlsxwriter::{Chart, ChartType, Workbook, XlsxError};

fn main() -> Result<(), XlsxError> {
    let mut workbook = Workbook::new();
    let worksheet = workbook.add_worksheet();

    // Add the worksheet data that the charts will refer to.
    let data = [
        [2, 3, 4, 5, 6, 7],
        [10, 40, 50, 20, 10, 50],
        [30, 60, 70, 50, 40, 30],
    ];
    worksheet.write_column_matrix(0, 0, data)?;

    // Create a new Column chart. This will be the primary chart.
    let mut column_chart = Chart::new(ChartType::Column);

    // Configure the data series for the primary chart.
    column_chart
        .add_series()
        .set_categories("Sheet1!$A$1:$A$6")
        .set_values("Sheet1!$B$1:$B$6");

    // Create a new line chart. This will use this as the secondary chart.
    let mut line_chart = Chart::new(ChartType::Line);

    // Configure the data series for the secondary chart.
    line_chart
        .add_series()
        .set_categories("Sheet1!$A$1:$A$6")
        .set_values("Sheet1!$C$1:$C$6");

    // Combine the charts.
    column_chart.combine(&line_chart);

    // Add some axis labels. Note, this is done via the primary chart.
    column_chart.x_axis().set_name("X axis");
    column_chart.y_axis().set_name("Y axis");

    // Add the primary chart to the worksheet.
    worksheet.insert_chart_with_offset(0, 3, &column_chart, 5, 5)?;

    // Save the file to disk.
    workbook.save("chart.xlsx")?;

    Ok(())
}
Output file:

Combined Column and Line chart with the Column values are on the primary Y axis and the Line chart values on the secondary Y2 axis.
// SPDX-License-Identifier: MIT OR Apache-2.0
//
// Copyright 2022-2026, John McNamara, jmcnamara@cpan.org

//! An example of creating a combined Column and Line chart. In this example the
//! Column values are on the primary Y axis and the Line chart values are on the
//! secondary Y2 axis.
use rust_xlsxwriter::{Chart, ChartType, Workbook, XlsxError};

fn main() -> Result<(), XlsxError> {
    let mut workbook = Workbook::new();
    let worksheet = workbook.add_worksheet();

    // Add the worksheet data that the charts will refer to.
    let data = [
        [2, 3, 4, 5, 6, 7],
        [10, 40, 50, 20, 10, 50],
        [30, 60, 70, 50, 40, 30],
    ];
    worksheet.write_column_matrix(0, 0, data)?;

    // Create a new Column chart. This will be the primary chart.
    let mut column_chart = Chart::new(ChartType::Column);

    // Configure the data series for the primary chart.
    column_chart
        .add_series()
        .set_categories("Sheet1!$A$1:$A$6")
        .set_values("Sheet1!$B$1:$B$6");

    // Create a new line chart. This will use this as the secondary chart.
    let mut line_chart = Chart::new(ChartType::Line);

    // Configure the data series for the secondary chart. This series is also
    // assigned to the secondary Y2 axis.
    line_chart
        .add_series()
        .set_categories("Sheet1!$A$1:$A$6")
        .set_values("Sheet1!$C$1:$C$6")
        .set_secondary_axis(true);

    // Combine the charts.
    column_chart.combine(&line_chart);

    // Add some axis labels. Note, this is done via the primary chart.
    column_chart.x_axis().set_name("X axis");
    column_chart.y_axis().set_name("Y axis");

    // The y2 axis properties are set also via the primary chart.
    column_chart.y2_axis().set_name("Y2 axis");

    // Add the primary chart to the worksheet.
    worksheet.insert_chart_with_offset(0, 3, &column_chart, 5, 5)?;

    // Save the file to disk.
    workbook.save("chart.xlsx")?;

    Ok(())
}
Output file:

The following is a slightly more realistic example of combining chart types to create a Pareto Chart.
// SPDX-License-Identifier: MIT OR Apache-2.0
//
// Copyright 2022-2026, John McNamara, jmcnamara@cpan.org

//! An example of creating a Pareto chart using the `rust_xlsxwriter` library.

use rust_xlsxwriter::{Chart, ChartType, Format, Workbook, XlsxError};

fn main() -> Result<(), XlsxError> {
    let mut workbook = Workbook::new();
    let worksheet = workbook.add_worksheet();

    // Formats used in the workbook.
    let bold = Format::new().set_bold();
    let percent_format = Format::new().set_num_format("0%");

    // Add the worksheet data that the charts will refer to.
    let headings = ["Reason", "Number", "Percentage"];

    let reasons = [
        "Traffic",
        "Child care",
        "Public Transport",
        "Weather",
        "Overslept",
        "Emergency",
    ];

    let numbers = [60, 40, 20, 15, 10, 5];
    let percents = [0.440, 0.667, 0.800, 0.900, 0.967, 1.00];

    worksheet.write_row_with_format(0, 0, headings, &bold)?;
    worksheet.write_column(1, 0, reasons)?;
    worksheet.write_column(1, 1, numbers)?;
    worksheet.write_column_with_format(1, 2, percents, &percent_format)?;

    // Widen the columns for visibility.
    worksheet.set_column_width(0, 15)?;
    worksheet.set_column_width(1, 10)?;
    worksheet.set_column_width(2, 10)?;

    //
    // Create a new Column chart. This will be the primary chart.
    //
    let mut column_chart = Chart::new(ChartType::Column);

    // Configure a series on the primary axis.
    column_chart
        .add_series()
        .set_categories("Sheet1!$A$2:$A$7")
        .set_values("Sheet1!$B$2:$B$7");

    // Add a chart title.
    column_chart.title().set_name("Reasons for lateness");

    // Turn off the chart legend.
    column_chart.legend().set_hidden();

    // Set the  name and scale of the Y axes. Note, the secondary axis is set
    // from the primary chart.
    column_chart
        .y_axis()
        .set_name("Respondents (number)")
        .set_min(0)
        .set_max(120);

    column_chart.y2_axis().set_max(1);

    //
    // Create a new Line chart. This will be the secondary chart.
    //
    let mut line_chart = Chart::new(ChartType::Line);

    // Add a series on the secondary axis.
    line_chart
        .add_series()
        .set_categories("Sheet1!$A$2:$A$7")
        .set_values("Sheet1!$C$2:$C$7")
        .set_secondary_axis(true);

    // Combine the charts.
    column_chart.combine(&line_chart);

    // Add the chart to the worksheet.
    worksheet.insert_chart(1, 5, &column_chart)?;

    workbook.save("chart_pareto.xlsx")?;

    Ok(())
}
Chart from the output file:
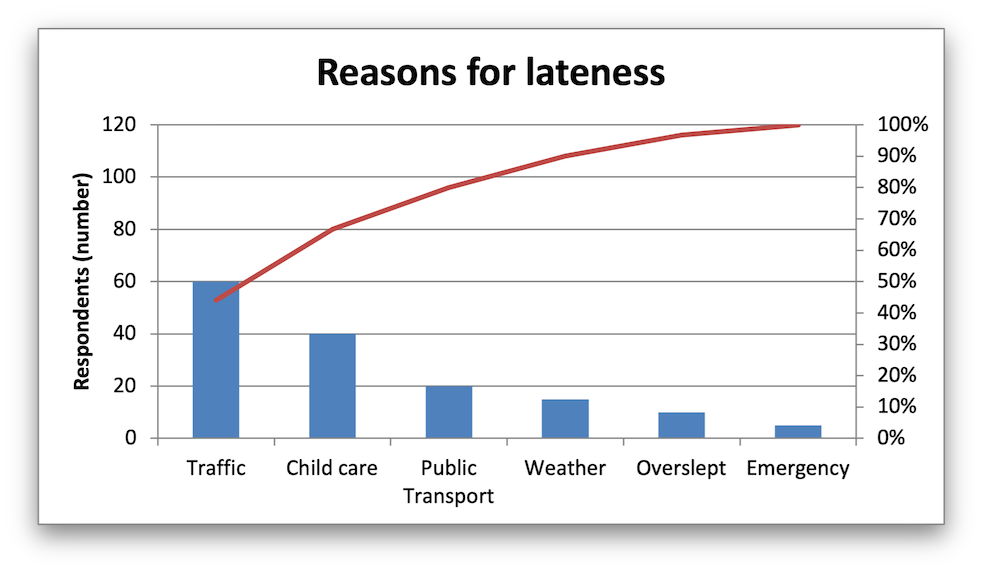
The examples above use the concept of a primary and secondary chart. The primary chart is the chart that defines the primary X and Y axis. It is also used for setting all chart properties apart from the secondary data series. For instance the chart title and axes properties should be set via the primary chart.
There are some limitations in the rust_xlsxwriter implementation of
combined charts:
- Only two charts can be combined.
- Scatter charts cannot currently be used as a primary chart but they can be used as a secondary chart.
- Bar charts can only combine secondary charts on a secondary axis. This is an Excel limitation.